Monthly Leadership Review

ARC Digital Performance July 2026

A monthly executive review of ARC's website reach, customer acquisition, store visibility, shopping intent and digital progress across the connected six-store platform.

July at a glance

2,239 Sessions
1,571 Users
15,143 Tracked Events
694 Click-to-Shop
Executive overview

July established a strong digital foundation.

ARC attracted more than 1,500 users, generated over 15,000 tracked interactions and moved hundreds of visitors toward store shopping pathways.

Sessions
2,239
Total visits across July
Engaged Sessions
2,233
99.7% engagement rate
Active Users
1,564
Customers actively using the website
New Users
1,501
First-time visitors during July
Average Engagement
2m 02s
Average time per active user
Page Views
5,032
Content views across the network
Total Events
15,143
Tracked customer interactions
Click-to-Shop
694
Customers entering shopping pathways
ARC Monthly Digital Score
9.0 / 10

A leadership interpretation of July's digital health, reach and strategic progress.

Organic visibility Excellent
Customer acquisition Strong
Shopping intent Meaningful
Store visibility Broad
Content depth Opportunity
Leadership takeaway

ARC now has measurable reach, engagement and shopping intent at scale.

July demonstrates that ARC's digital ecosystem is no longer a collection of isolated pages. The unified homepage, six store websites, Product Finders, AI assistants and Emily content are operating as connected assets.

What matters most:
Organic Search delivered the majority of July's traffic, while 694 Click-to-Shop actions show that website visibility translated into meaningful commercial intent.
Customer acquisition

Organic Search powered July.

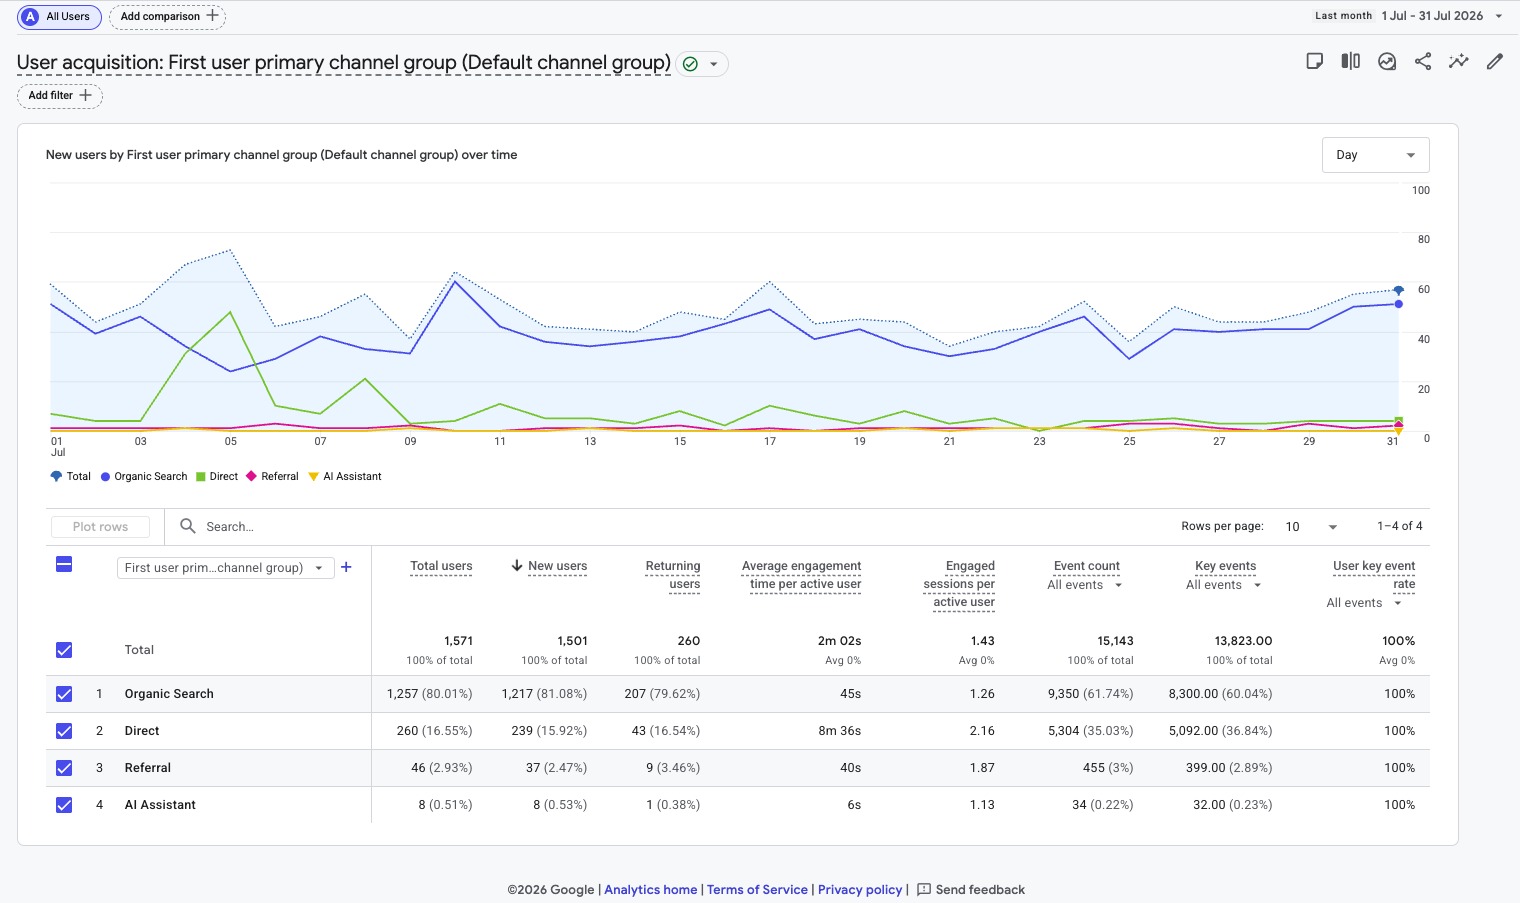
Search engines introduced the majority of both first-time users and total website sessions.

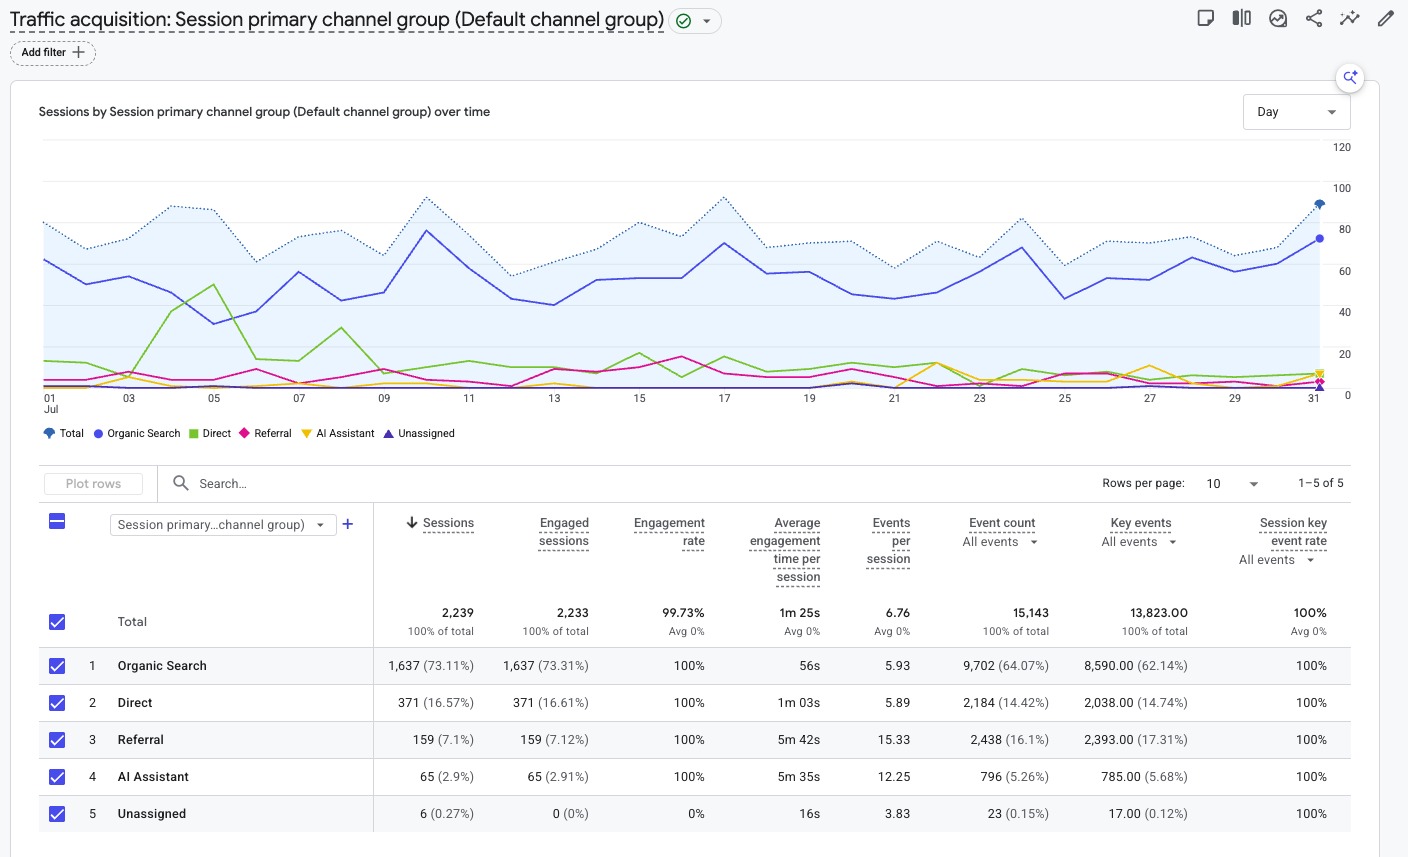
1,637

Organic Search sessions

73.1% of all July sessions came through Organic Search.

  • 1,257 users were acquired through Organic Search.
  • 1,217 new users first discovered ARC through search.
  • Organic Search generated 9,702 events .
  • It contributed 8,590 key events .

Monthly traffic mix

Channel Sessions Share
Organic Search 1,637 73.1%
Direct 371 16.6%
Referral 159 7.1%
AI Assistant 65 2.9%
Unassigned 6 0.3%
Emerging signal:
AI Assistant traffic produced 65 sessions with an average engagement time of 5m 35s.
Store visibility

All six locations attracted meaningful attention.

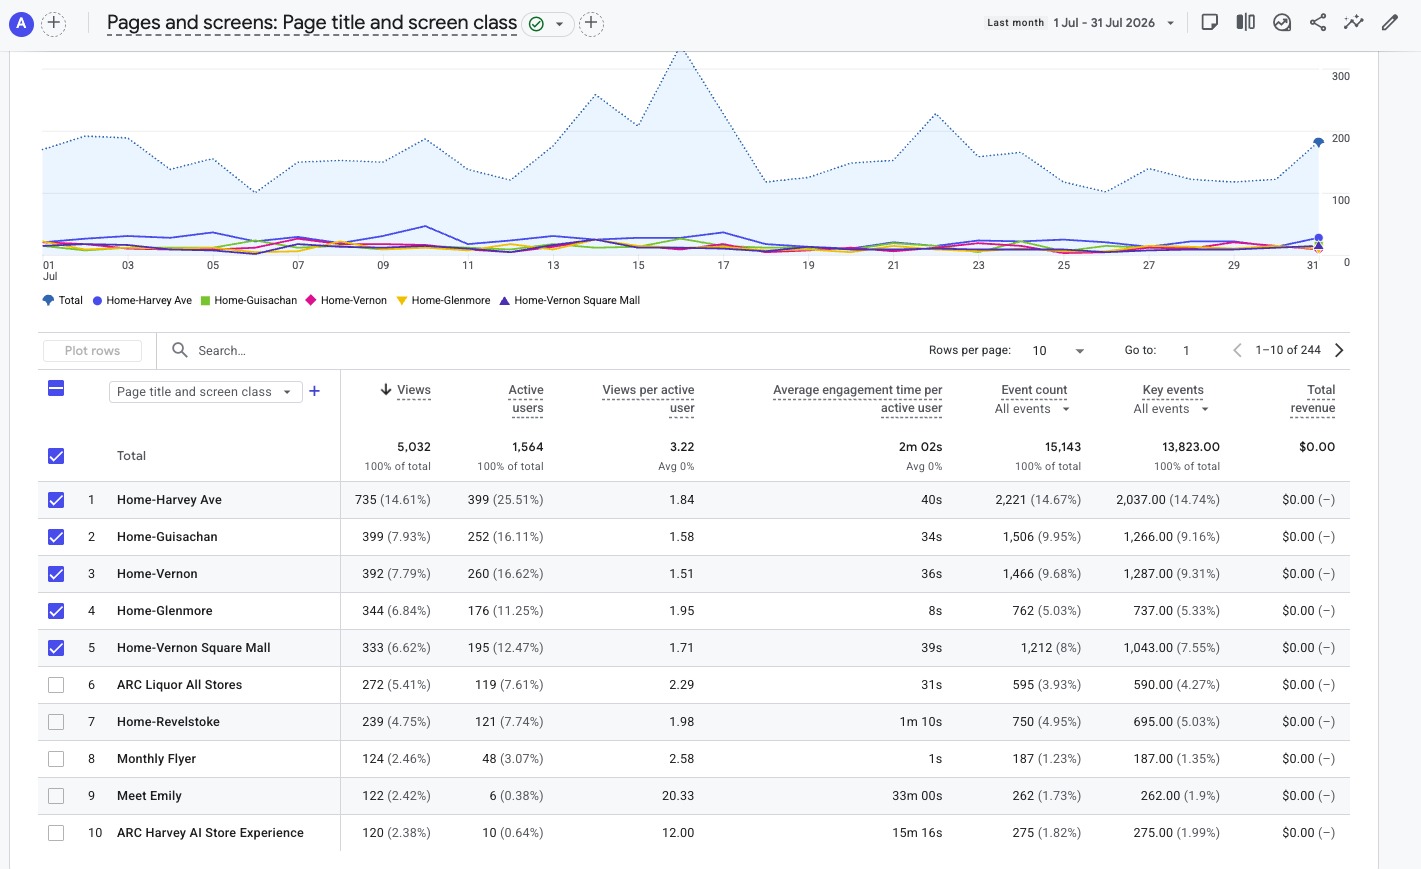
Harvey led July, but the wider network also generated substantial reach.

Page Views Active Users Key Events
Home – Harvey Ave 735 399 2,037
Home – Guisachan 399 252 1,266
Home – Vernon 392 260 1,287
Home – Glenmore 344 176 737
Home – Vernon Square Mall 333 195 1,043
ARC Liquor All Stores 272 119 590
Home – Revelstoke 239 121 695
Monthly Flyer 124 48 187
Meet Emily 122 6 262
ARC Harvey AI Store Experience 120 10 275
Strategic interpretation:
The website no longer depends solely on Harvey. Customers are reaching multiple store pages, the All Stores gateway and emerging editorial experiences.
Customer actions

July generated substantial commercial intent.

Hundreds of visitors clicked, entered shopping pathways and completed forms.

General Clicks
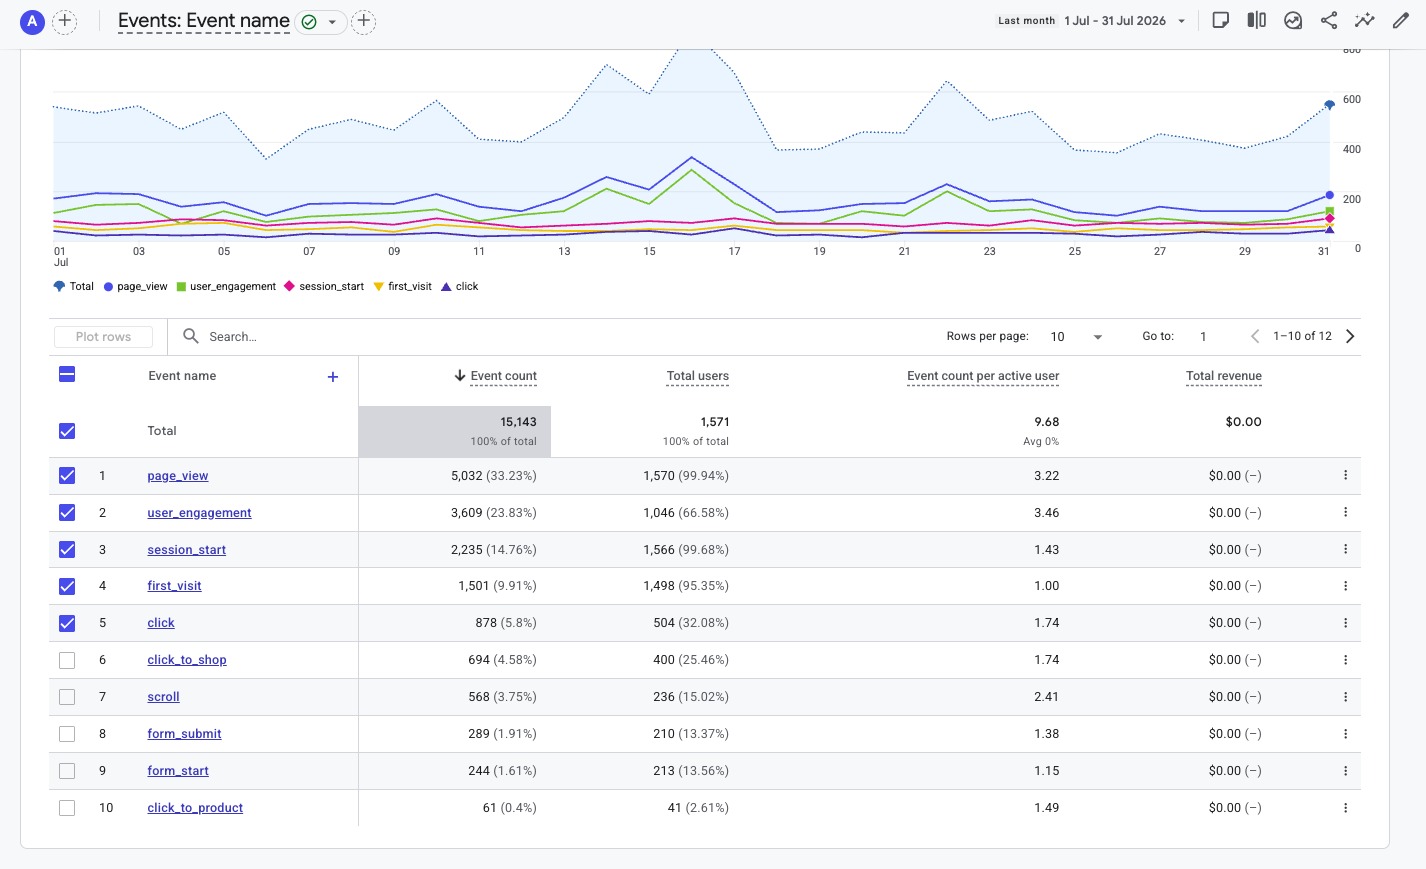
878
504 users clicked site elements
Click-to-Shop
694
400 users entered shopping pathways
Scroll Events
568
236 users explored page content
Form Submissions
289
210 users completed forms
Form Starts
244
213 users began forms
Product Clicks
61
41 users clicked products
Customer journey

ARC's digital ecosystem is becoming connected.

July's analytics show the major pieces operating together.

Google Search
ARC Gateway
Store Page
Emily / Product Finder
Wine Story
Ask Emily
Click-to-Shop
Visit / Purchase
Month in review

July's progress went beyond analytics.

The monthly report documents what ARC built, launched and improved.

ARC Brand Gateway

The main domain was transformed from a Harvey-first entry page into a gateway connecting customers with all six ARC stores.

Emily Brand Experience

Meet Emily, Summer Selects, winery stories and AI guidance began forming one customer-facing wine experience.

AI Ecosystem Expansion

Conversational AI, Voice AI, Sommeliers and Product Finders continued moving toward a consistent ARC Gold Standard.

July achievements

What ARC completed

  • Launched the new ARC All Stores homepage.
  • Introduced Meet Emily and Summer Selects.
  • Expanded store-specific AI assistants and Sommeliers.
  • Refreshed Product Finder and inventory standards.
  • Established weekly Gold Standard leadership reporting.
  • Created a repeatable training roadmap.
August priorities

Where the strategy goes next

  • Complete and promote Emily's Summer Selects.
  • Launch the Harvey in-store Emily display.
  • Add QR and campaign tracking.
  • Begin member and social media promotion.
  • Evaluate paid advertising opportunities.
  • Continue internal training for Colin and Jason.
“July laid the digital foundations. August is where ARC begins turning visibility into measurable customer growth.”
Supporting GA4 reports

The data behind July's leadership story.

These screenshots provide the detailed GA4 evidence supporting the monthly analysis.

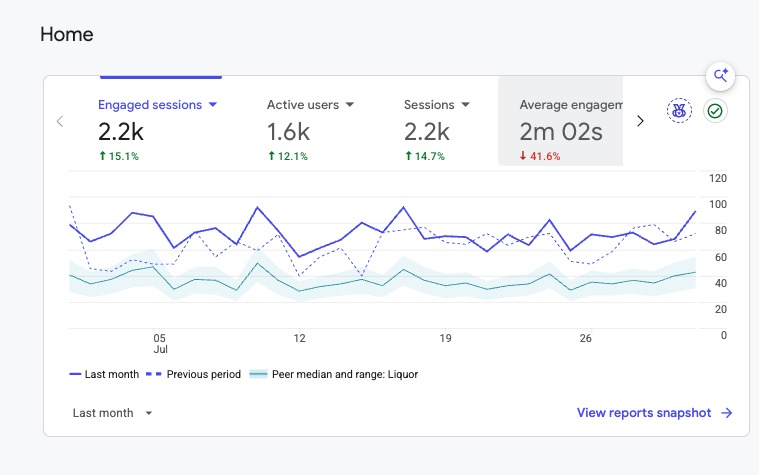
GA4 Home snapshot for July 2026
Home snapshot: July sessions, users and engagement.
GA4 User Acquisition report for July 2026
User Acquisition: how users originally discovered ARC.
GA4 Traffic Acquisition report for July 2026
Traffic Acquisition: the source of July's sessions.
GA4 Pages and Screens report for July 2026
Pages & Screens: ARC pages attracting the greatest attention.
GA4 Events report for July 2026
Events: tracked actions completed during July.
Understanding the report

What the GA4 terms mean.

These definitions explain the main measurements used throughout the July Leadership Report and why each one matters to ARC Liquor.

A simple way to read the report:
Traffic measurements tell us how many people reached the website. Engagement measurements show what they did after arriving. Shopping and form actions indicate whether that attention developed into customer intent.
V

Views

What it means

A View is recorded whenever someone loads or revisits a page on the ARC website.

One visitor can generate several Views by exploring multiple store, product, wine or information pages.

Why leadership should care: Views identify the pages and content receiving the greatest customer attention.
U

Active Users

What it means

Active Users represent the number of individual people who actively interacted with the website during the reporting period.

Unlike Views, the same person is not counted again every time they open another page.

Why leadership should care: This is one of the clearest measurements of ARC's true digital audience size.
N

New Users

What it means

New Users are people visiting the ARC website for the first time during the reporting period.

They may have discovered ARC through Google Search, a referral, direct navigation, AI Assistant traffic or another source.

Why leadership should care: Growth in New Users demonstrates that ARC is reaching people beyond its existing website audience.
S

Sessions

What it means

A Session represents one visit to the website.

One customer can create several Sessions by returning to the website on different days or at different times.

Why leadership should care: Sessions show the total volume of website visits and help identify repeat interest.
E

Engaged Sessions

What it means

An Engaged Session is a visit where the customer demonstrated meaningful activity.

This can include remaining on the site, viewing multiple pages or completing an important interaction.

Why leadership should care: Engaged Sessions distinguish meaningful visits from brief or accidental traffic.
T

Average Engagement Time

What it means

Average Engagement Time measures how long visitors actively interact with the ARC website.

Time where a tab is simply left open in the background is generally excluded.

Why leadership should care: Longer engagement can indicate that visitors are reading, comparing products or exploring ARC's content in greater depth.
K

Key Events

What it means

Key Events are interactions that have been identified as especially important for measuring ARC's digital performance.

Depending on the tracking setup, these may include page views, shopping clicks, product clicks, form actions and other meaningful customer behaviour.

Why leadership should care: Key Events show whether visitors are taking useful actions rather than only arriving at the website.
A

Event Count

What it means

Event Count is the total number of tracked interactions recorded across the website.

These include Views, clicks, scrolling, form activity and shopping actions.

Why leadership should care: Event Count helps show how much overall activity the website generated during the month.
C

Click

What it means

Click records customer interaction with links, navigation items, buttons and other clickable elements.

It is a broad measurement and may include several different types of website action.

Why leadership should care: Click activity shows that visitors are exploring and interacting, rather than simply viewing a single page.
S

Click-to-Shop

What it means

Click-to-Shop records when a customer leaves the ARC website and enters a store's online shopping experience.

This is one of ARC's most important measures of commercial intent.

Why leadership should care: It demonstrates that website activity is progressing toward product browsing and potential purchase.
P

Click-to-Product

What it means

Click-to-Product records a visitor selecting a specific product or product-shopping link.

It is a narrower action than a general Click and indicates interest in an individual item.

Why leadership should care: Product-level clicks provide evidence that customers are moving from general browsing toward specific purchase consideration.
F

Form Start and Form Submit

What it means

Form Start records when a visitor begins entering information into a website form.

Form Submit records when the completed form is successfully sent.

Why leadership should care: Comparing these two figures helps show both customer interest and the effectiveness of the form experience.
R

Scroll

What it means

Scroll is recorded when a visitor moves sufficiently far through a page to demonstrate deeper content consumption.

It is particularly useful for longer winery, product, AI and editorial pages.

Why leadership should care: Scroll activity helps reveal whether visitors are reading beyond the opening section of a page.
O

Organic Search

What it means

Organic Search represents visitors who discovered ARC through unpaid results on Google or another search engine.

It does not include paid advertising clicks.

Why leadership should care: Strong Organic Search performance demonstrates the long-term value of store pages, content, search visibility and local SEO.
D

Direct Traffic

What it means

Direct Traffic usually represents visitors who typed ARC's address into their browser, used a bookmark or arrived without a clearly identifiable referral source.

Why leadership should care: Direct Traffic may indicate brand recognition, repeat visits or offline awareness.
AI

AI Assistant Traffic

What it means

AI Assistant Traffic represents visits attributed to AI platforms or AI-assisted discovery sources.

This is still an emerging acquisition category and may evolve as analytics platforms improve their classification.

Why leadership should care: It provides early evidence that customers are beginning to discover ARC through AI-generated recommendations and search experiences.
How these measurements connect to ARC's business goals

No single statistic tells the complete story. Leadership should read these measurements together as stages within the customer journey.

Reach Active Users, New Users and Organic Search show how many people ARC is attracting.
Engagement Views, Engaged Sessions, Engagement Time and Scroll show how deeply visitors explore the website.
Customer Intent Click-to-Shop, Product Clicks and Form Submissions show customers moving closer to enquiry or purchase.
Leadership Summary

July at a Glance

Beyond the individual statistics, July demonstrated measurable progress across ARC's digital ecosystem. New customer experiences were launched, website reach expanded, and ARC's investment in AI and customer-focused technology continued to strengthen.

1,571

Customers Reached

More than fifteen hundred users interacted with ARC's digital platforms during July, generating over 15,000 measurable website events.

5,032

Page Views

Customers explored store locations, promotions, product information, wine content and AI experiences more than five thousand times.

73.1%

Organic Search Traffic

Organic Search remained ARC's strongest traffic source, demonstrating the value of local SEO, store pages and customer-focused website content.

6

Stores Connected

The ARC gateway homepage now connects visitors with all six stores through one consistent digital brand experience.

Key Leadership Takeaways

What July demonstrated

01

ARC successfully launched a unified multi-store homepage and customer gateway.

02

Organic Search continued to drive the majority of ARC's website traffic and new customer discovery.

03

Emily developed into a measurable customer-facing wine experience supported by content, AI and curated selections.

04

Product Finders, store pages, conversational AI and Voice AI continued moving toward one consistent ARC Gold Standard.

05

July produced 694 Click-to-Shop actions, demonstrating meaningful customer purchase intent.

06

ARC now has a stronger foundation for future social campaigns, member communications and paid advertising.