Sessions
430
▲ 24.3%
More reach. Stronger shopping intent. Clear priorities.
Week 29 grew in both reach and shopping intent: 430 sessions (▲ 24.3%), 337 active users (▲ 33.2%), 304 new users (▲ 38.8%) and 783 page views (▲ 16.9%). Click-to-Shop increased to 111 actions (▲ 32.1%) across 67 users.
Search visibility needs attention. The scorecard is a qualitative assessment; no numerical grade is assigned.
| Metric | Week 29 | WoW change | Reading |
|---|---|---|---|
| Sessions | 430 | ▲ 24.3% | More visits |
| Active users | 337 | ▲ 33.2% | Wider audience |
| New users | 304 | ▲ 38.8% | Stronger discovery |
| Engaged sessions | 421 | ▲ 21.7% | 97.91% engagement rate |
| Page views | 783 | ▲ 16.9% | 2.32 views per active user |
| Avg. engagement / active user | 57s | ▼ 7.8% | Per-session average: 44s |
| Total users | 338 | Not shown | User Acquisition total |
| Total events | 2,437 | Not shown | All recorded actions |
| Click-to-Shop | 111 | ▲ 32.1% | 67 users |
| Click-to-Product | 7 | Not shown | 5 users |
| Key events | 2,252 | Not shown | Broad configuration; not a sales total |
▲ and ▼ show the direction of change. “Not shown” means the supplied screenshots do not provide a comparison; it does not mean no change.
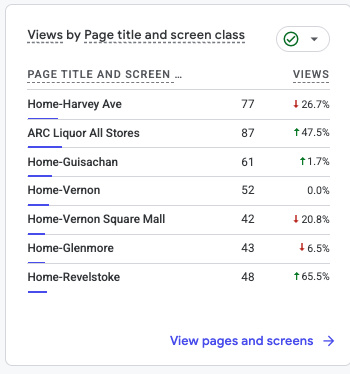
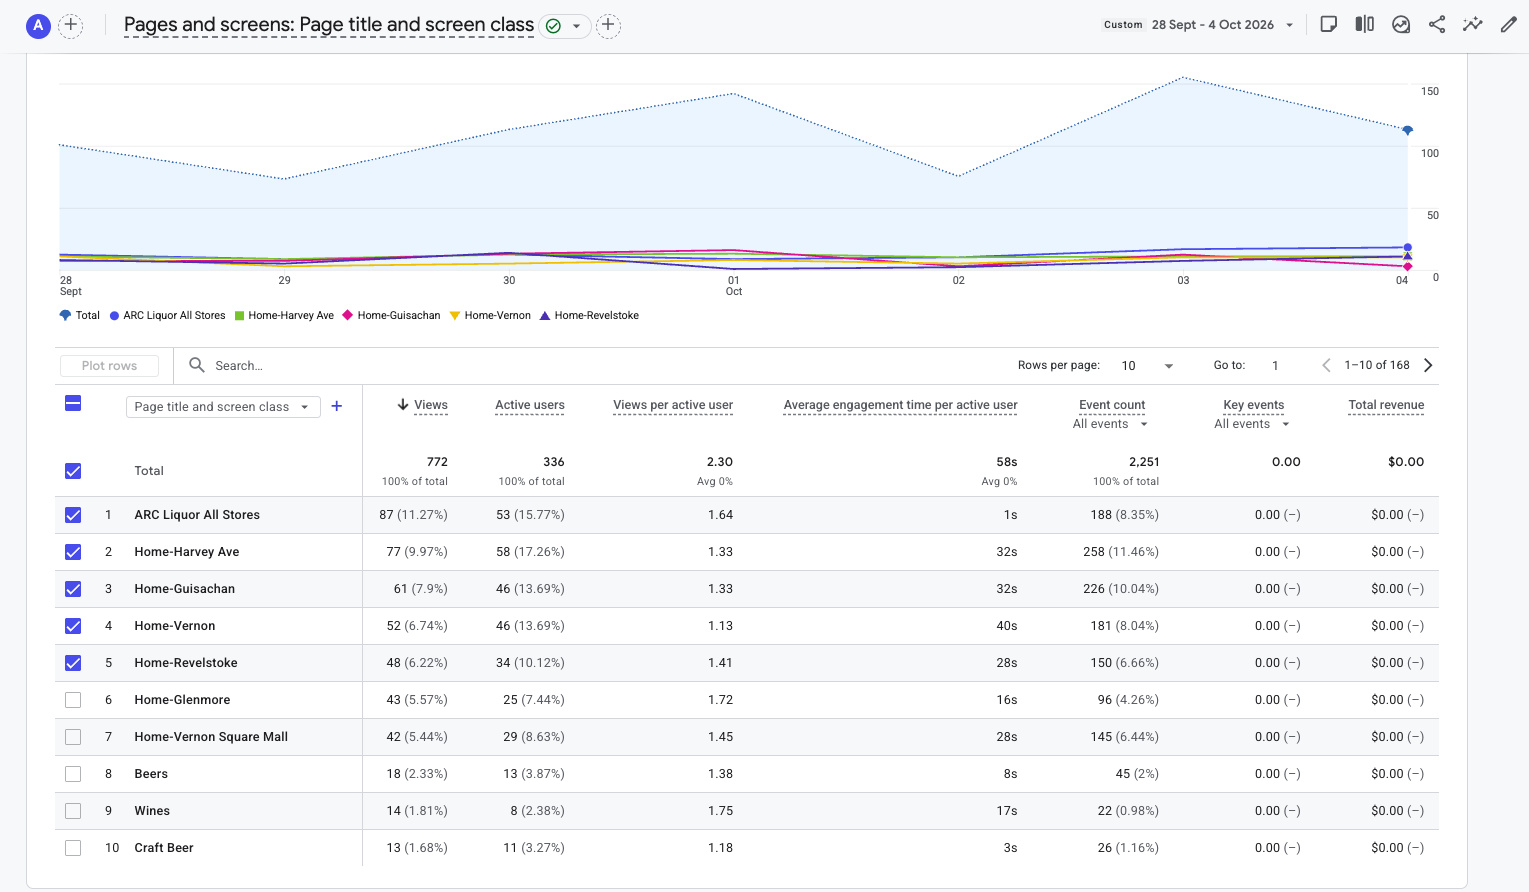
The six store homepages recorded 322 views. With the All Stores gateway, these pages contributed 410 views, or 52.4% of all 783 views. Active users overlap across pages and should not be added.
| Page | Views | Active users | Avg. engagement | Views WoW |
|---|---|---|---|---|
| ARC Liquor All Stores | 88 | 54 | 1s | ▲ 46.7% |
| Harvey Avenue | 75 | 58 | 32s | ▼ 28.6% |
| Guisachan | 64 | 46 | 32s | ▲ 6.7% |
| Vernon 58th Avenue | 50 | 45 | 42s | ▼ 3.8% |
| Revelstoke | 49 | 34 | 29s | ▲ 63.3% |
| Glenmore | 44 | 26 | 15s | ▼ 6.4% |
| Vernon Square Mall | 40 | 28 | 29s | ▼ 32.2% |
| Beers | 18 | 14 | 9s | Not shown |
| Wines | 16 | 8 | 19s | Not shown |
| Craft Beer | 13 | 11 | 4s | Not shown |
Gateway and Revelstoke visibility increased, while several store pages softened. Gateway engagement was 1s; quick onward navigation is a possible explanation that needs store-selection evidence.
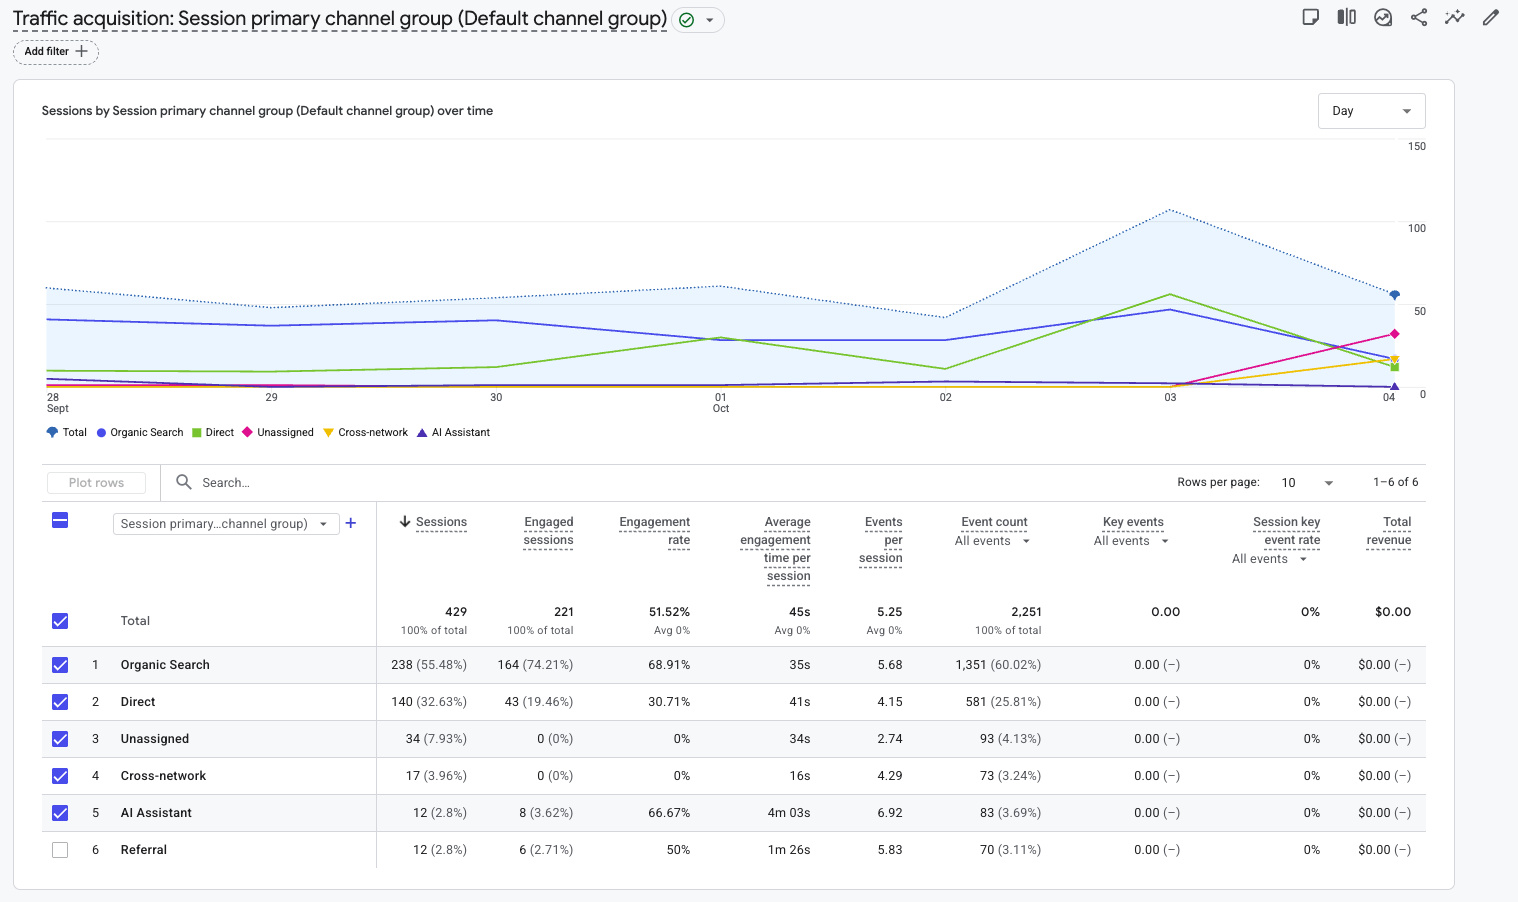
| Channel | Sessions | GA4 share | Engaged sessions | Engagement rate | Sessions WoW |
|---|---|---|---|---|---|
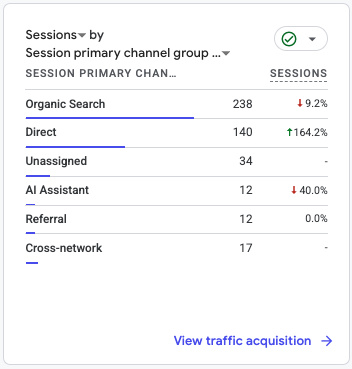
| Organic Search | 234 | 54.42% | 234 | 100% | ▼ 10.7% |
| Direct | 142 | 33.02% | 142 | 100% | ▲ 173.1% |
| Unassigned | 36 | 8.37% | 0 | 0% | Not shown |
| Cross-network | 20 | 4.65% | 20 | 100% | Not shown |
| Referral | 13 | 3.02% | 13 | 100% | ▲ 8.3% |
| AI Assistant | 12 | 2.79% | 12 | 100% | ▼ 40.0% |
Organic Search remained the largest reported channel, despite its decline. Direct supplied the strongest growth. GA4 reports 421 engaged sessions, a 97.91% engagement rate and 44s average engagement per session. Because routine events are marked as key events, the very high engagement rate needs interpretation alongside time and meaningful actions.
The six displayed channel rows sum to 457 sessions, exceeding the 430 headline by 27; their shares total 106.27%. The engaged-session rows sum to 421, matching the headline. Figures are retained exactly as shown. Check channel definitions and re-export this report before treating the channel mix as a reconciled distribution.
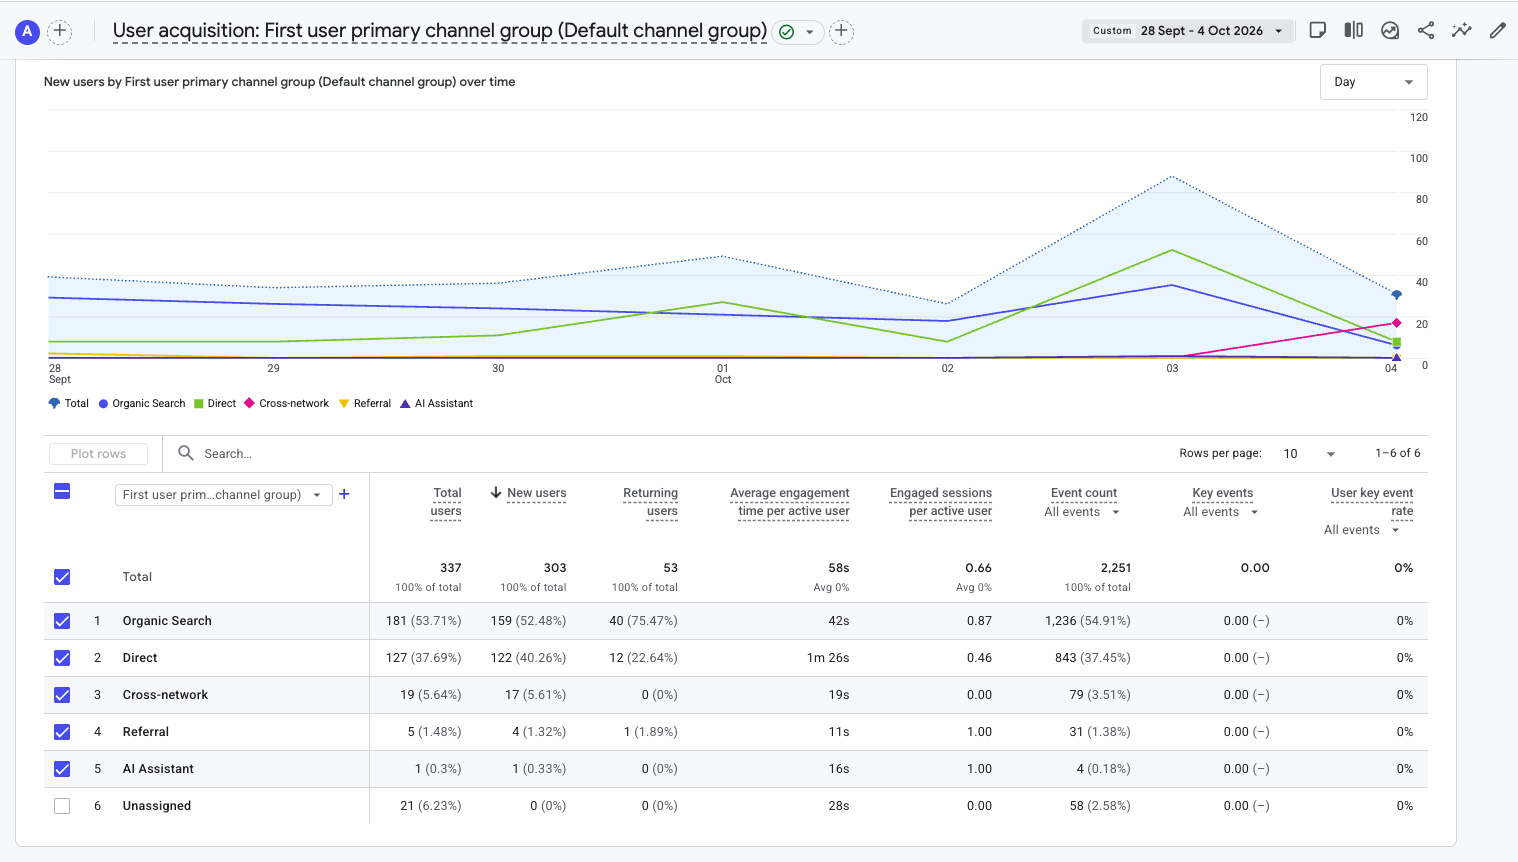
First-user acquisition recorded 304 new users: 156 Organic Search, 122 Direct, 21 Cross-network, four Referral and one AI Assistant. Total users were 338 and returning users 53. These first-user channels differ from session channels; new and returning users can overlap within the week.
| Event | Count | Total users | Count WoW |
|---|---|---|---|
| page_view | 783 | 337 | ▲ 16.9% |
| user_engagement | 468 | 192 | ▼ 0.4% |
| session_start | 421 | 332 | ▲ 21.3% |
| first_visit | 304 | 302 | ▲ 38.8% |
| click | 138 | 87 | ▲ 25.5% |
| scroll | 138 | 108 | ▲ 70.4% |
| click_to_shop | 111 | 67 | ▲ 32.1% |
| form_submit | 37 | 23 | Not shown |
| form_start | 26 | 24 | Not shown |
| click_to_product | 7 | 5 | Not shown |
Clicks rose 25.5% and scrolls rose 70.4%, while user_engagement events were nearly flat (▼ 0.4%). Shopping actions improved even as average engagement time softened. The report shows the first 10 of 12 event types; only the visible rows are transcribed here. No week-over-week change is supplied for product clicks, forms or total events.
37 form_submit events involved 23 users; 26 form_start events involved 24 users. These are recorded events, not a verified enquiry count or valid completion funnel.
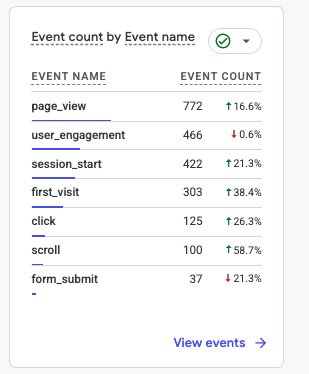
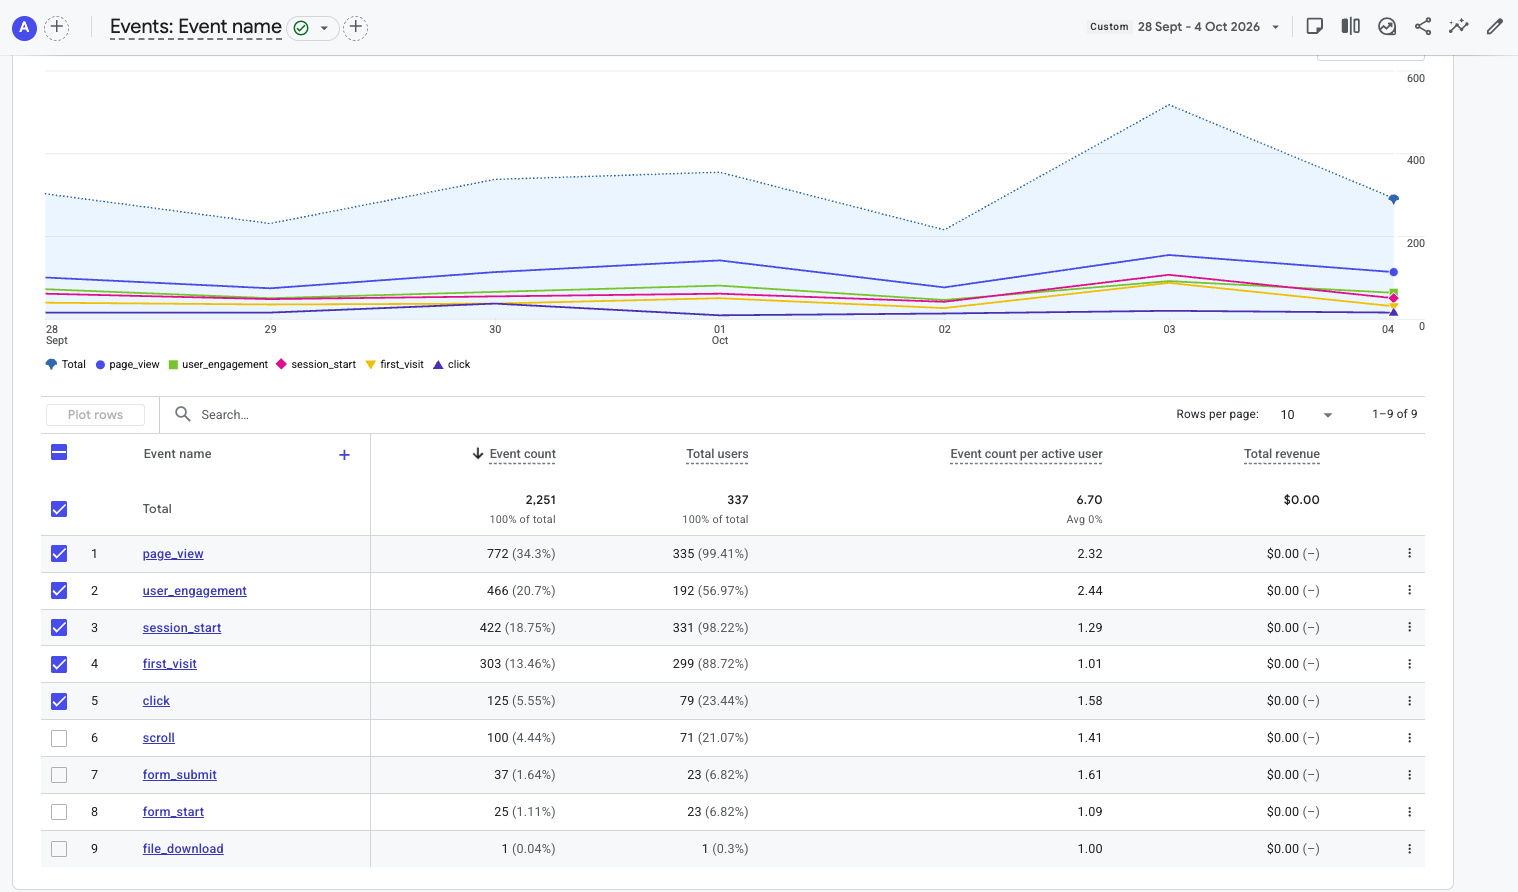
Shopping events are present: click_to_shop recorded 111 events across 67 users, and click_to_product recorded 7 events across 5 users. These indicate shopping-path activity, not completed purchases. GA4 reports 2,252 key events; routine events including page_view and session_start are marked as key events, so this total and the 100% session key-event rate should not be read as commercial conversion.
| Measure | Week 29 | Meaning |
|---|---|---|
| Click-to-Shop | 111 events / 67 users | ▲ 32.1%; outbound shopping intent |
| Click-to-Product | 7 events / 5 users | Product-level intent; comparison not shown |
| Key events | 2,252 | Broadly configured; not a sales count |
| Session key-event rate | 100% | Configuration-dependent; not purchase conversion |
| GA4 revenue | $0 | Store and external sales are not established here |

12 sessions (▼ 40.0%), 4m 03s average engagement per session and 83 events. The report labels all 12 sessions engaged; interpret this alongside the broad key-event settings. One new user was attributed to AI Assistant in first-user acquisition. This small sample describes attributed website traffic, not chatbot conversations.
Original ARC leadership commentary.
Source: corrected ARC GA4 screenshots for September 28–October 4, 2026. Comparison cards show September 21–27. Exact table values take precedence over rounded cards. No exact prior-week totals are inferred. Sessions (430) and session_start events (421) are separate metrics. Revenue is $0 in GA4; this does not establish the absence of store or external-platform sales. The displayed benchmark group is Alcoholic Beverages; no peer-performance conclusion is drawn.