Enhanced Leadership Performance Report
Website audience growth, store discovery and shopping-path activity.
ARC Digital Scorecard
Subjective leadership interpretation, not a GA4 metric. Reach and shopping actions strengthened, while measurement questions remain.
| Area | Direction |
|---|---|
| Reach | Growing |
| Direct traffic | Strong gain |
| Shopping intent | Improving |
| Organic traffic | Watch |
| Measurement | Reconcile rows |
Weekly Wins
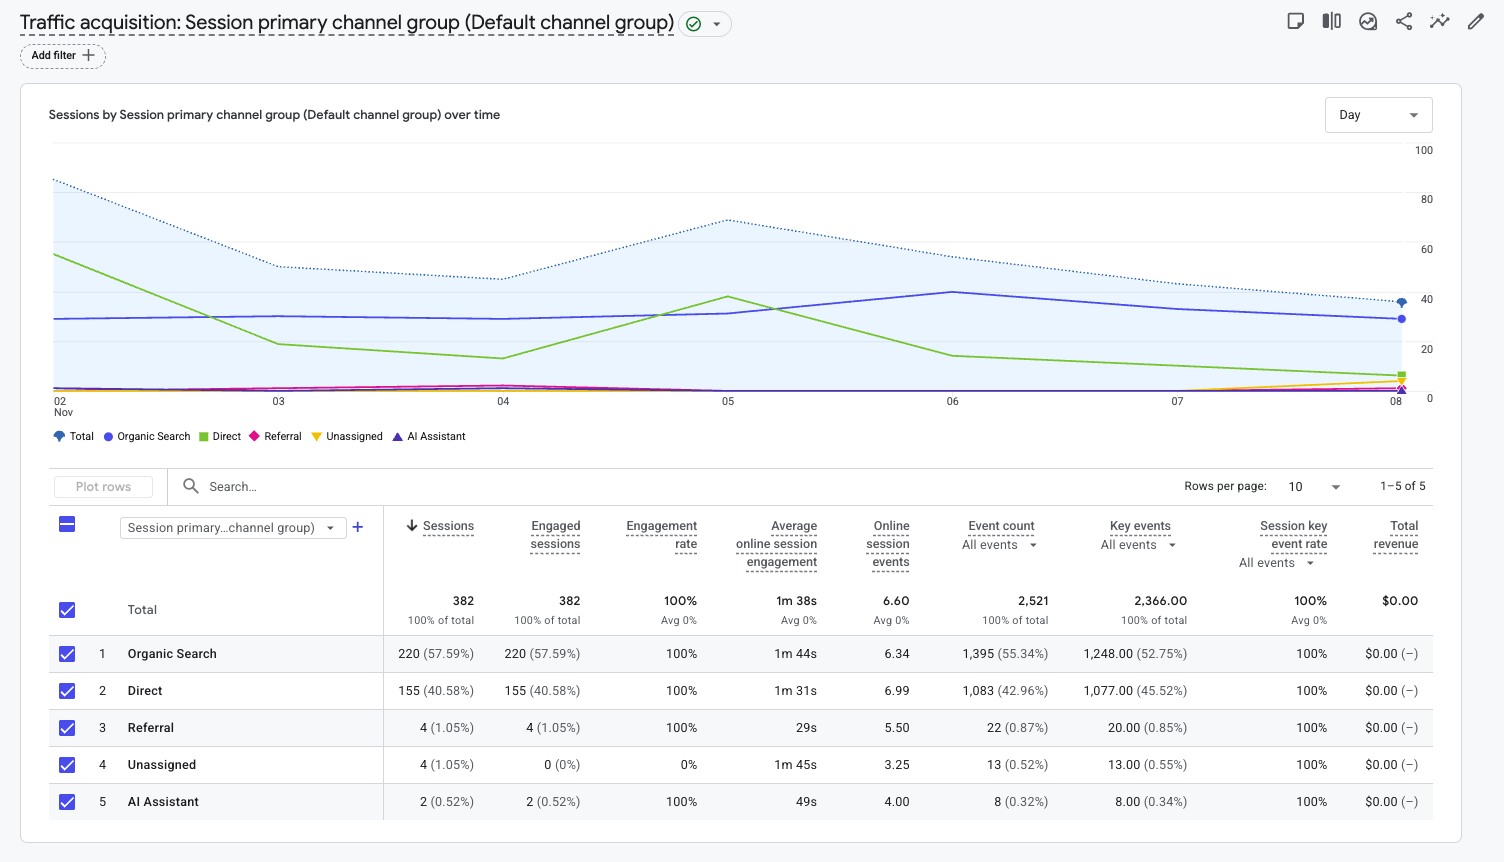
- 382 sessions (▲ 7.3%) and 382 engaged sessions (▲ 7.3%).
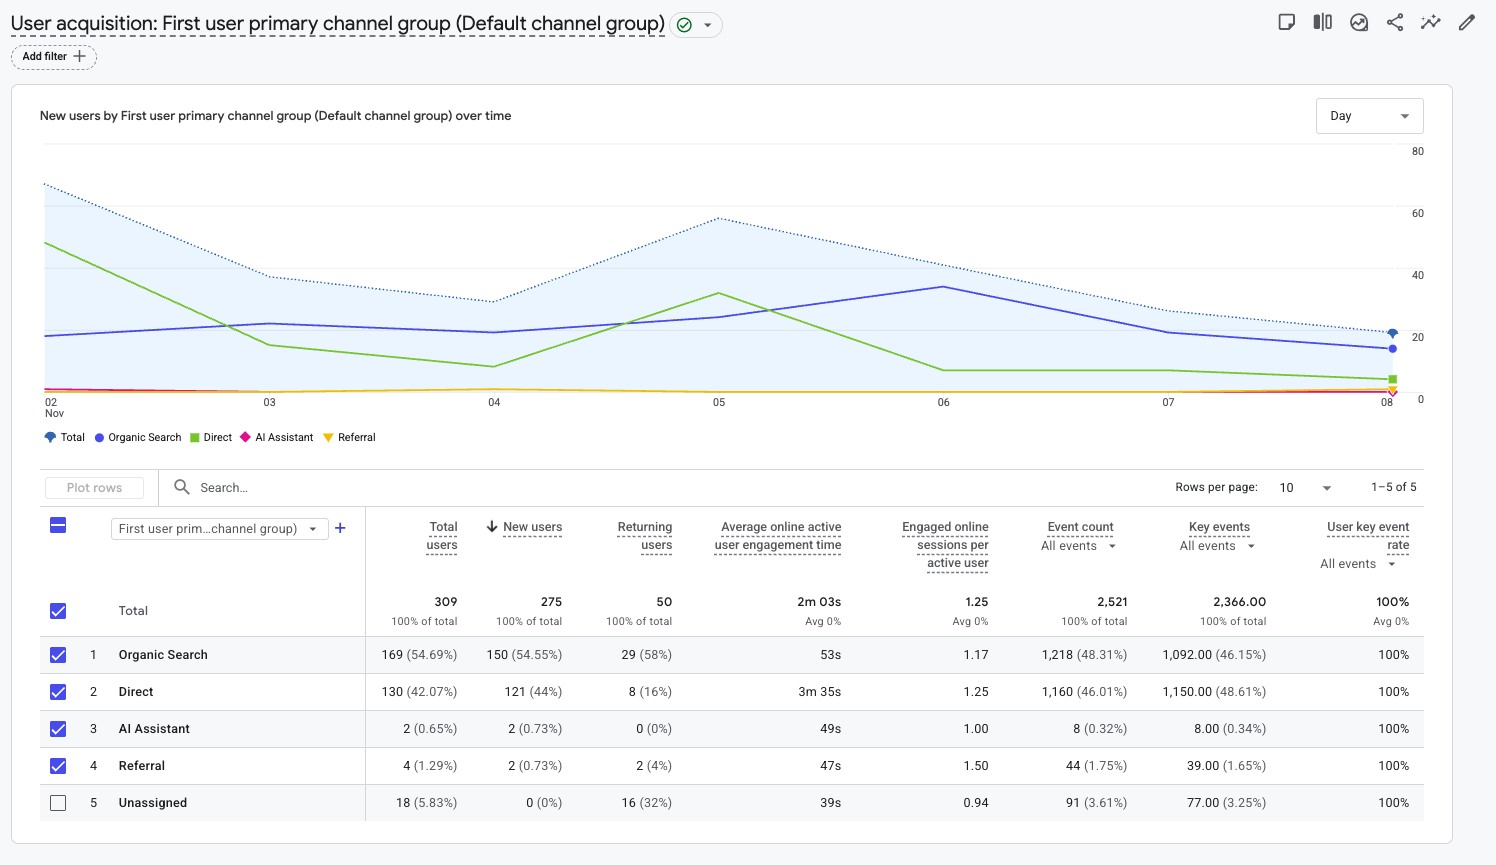
- 305 active users and 275 new users (both above Week 33).
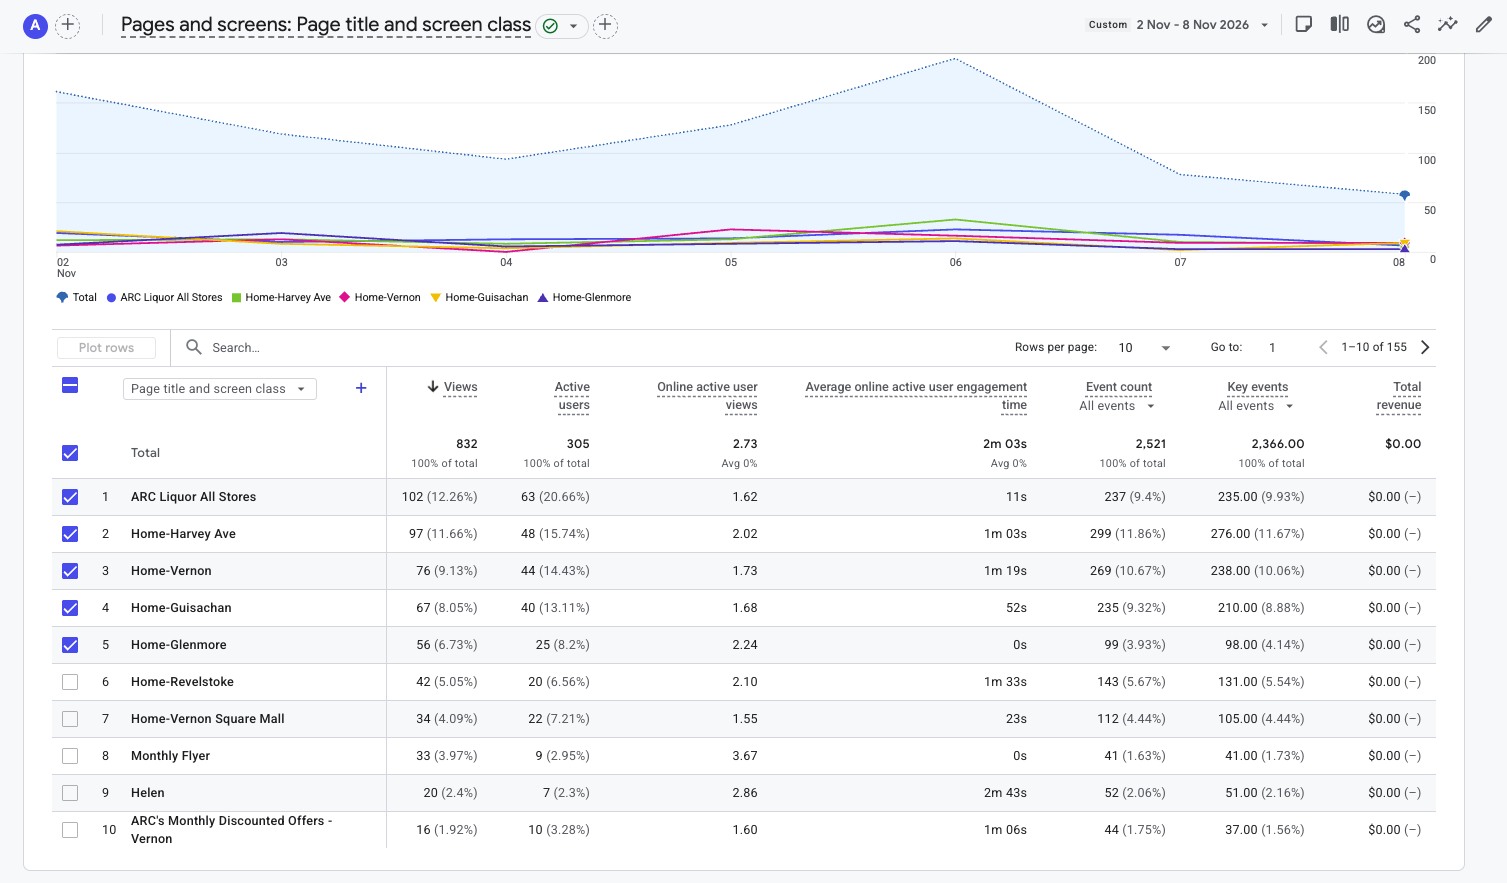
- 832 page views (up 105 from Week 33).
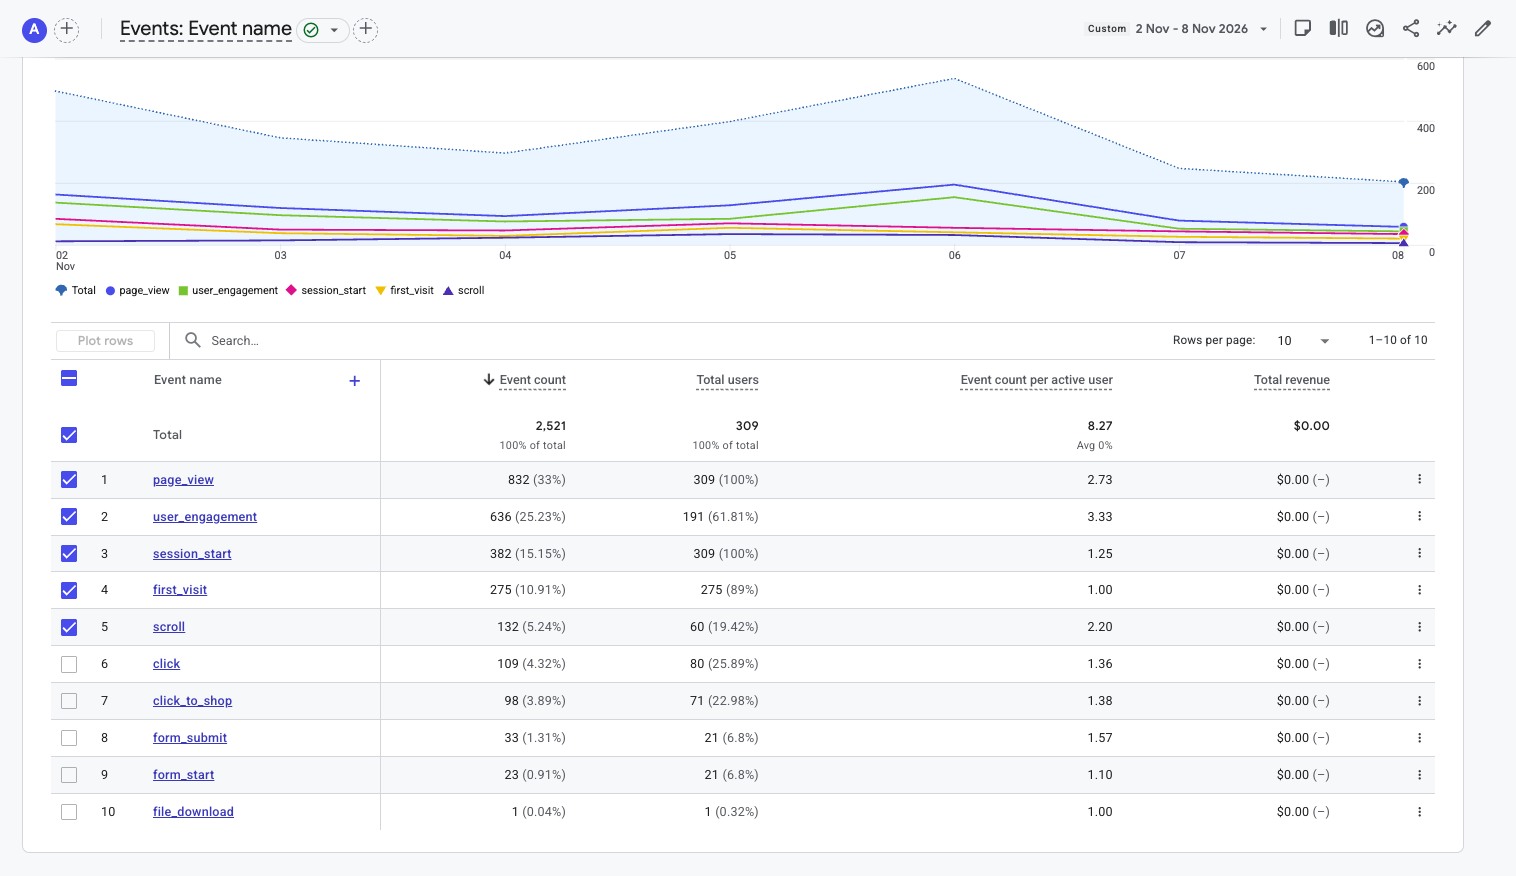
- 98 Click-to-Shop events from 71 users (up from 92 and 68).
- Direct sessions rose from 103 to 155; All Stores gateway rose from 69 to 102 views.
- Vernon, Harvey, Guisachan and Revelstoke all grew in page visibility.
Watch List
- Organic Search fell from 243 to 220 sessions, despite remaining the largest source.
- Vernon Square Mall dropped to 34 views from 49.
- GA4 channel rows total 385, three above the 382 headline.
- Helen page: 20 views from seven users; internal testing is a plausible contributor.
- The 100% key-event rate is not a purchase conversion rate.
Week 34: Positive Momentum Continues
Week 34 recorded stronger traffic, new-user acquisition and shopping-path activity. Direct traffic grew sharply, the All Stores gateway topped page views, and Click-to-Shop increased to 98. These are positive digital signals, not proof of sales.
Performance Overview
| Metric | Week 34 | Change | Interpretation |
|---|---|---|---|
| Sessions | 382 | ▲ 7.3% | More visits; GA4 headline |
| Engaged sessions | 382 | ▲ 7.3% | 100% reported engagement rate; configuration-dependent |
| Active users | 305 | ▲ 10.1%* | Calculated vs Week 33: 277 |
| New users | 275 | ▲ 12.2%* | Calculated vs Week 33: 245 |
| Page views | 832 | ▲ 14.4%* | Calculated vs Week 33: 727 |
| Avg engagement / active user | 2m 03s | ▼ 2.6% | Slightly lower than 2m 07s |
| Total users | 309 | ▲ 10.0%* | Calculated vs Week 33: 281 |
| Total events | 2,521 | ▲ 10.6% | Home comparison card |
| Click-to-Shop | 98 | ▲ 6.5%* | 71 users; compared with 92 events |
| Key events | 2,366 | ▲ 11.8%* | Broad event configuration, not sales |
Traffic Acquisition
| Channel | Sessions | Share | Engaged | Avg time | Change |
|---|---|---|---|---|---|
| Organic Search | 220 | 57.59% | 220 | 1m 44s | ▼ 9.5%* |
| Direct | 155 | 40.58% | 155 | 1m 31s | ▲ 50.5%* |
| Referral | 4 | 1.05% | 4 | 29s | ▼ 42.9%* |
| Unassigned | 4 | 1.05% | 0 | 1m 45s | ▼ 33.3%* |
| AI Assistant | 2 | 0.52% | 2 | 49s | ▼ 33.3%* |
Direct climbed from 103 to 155 sessions, while Organic Search eased from 243 to 220. The detailed channel rows sum to 385 versus GA4’s 382-session headline.
Store & Content Performance
| Page | Views | Change |
|---|---|---|
| ARC Liquor All Stores | 102 | ▲ 47.8%* |
| Harvey Avenue | 97 | ▲ 10.2%* |
| Vernon 58th Avenue | 76 | ▲ 26.7%* |
| Guisachan | 67 | ▲ 11.7%* |
| Glenmore | 56 | ▲ 3.7%* |
| Revelstoke | 42 | ▲ 16.7%* |
| Vernon Square Mall | 34 | ▼ 30.6%* |
What This Means
ARC’s All Stores gateway led with 102 views, followed by Harvey (97), Vernon (76) and Guisachan (67). Helen showed 20 views from seven users, which may include internal testing. No customer-usage conclusion should be drawn from this small sample.
Customer Intent
| Measure | Week 34 | Interpretation |
|---|---|---|
| Click-to-Shop | 98 events / 71 users | ▲6.5% events versus last week |
| Clicks | 109 / 80 users | Slightly lower than 112 |
| Scroll | 132 / 60 users | Modestly higher |
| Form submits | 33 / 21 users | Events, not verified leads |
| File downloads | 1 / 1 user | Not commercial proof |
AI Assistant Signal
Two AI Assistant sessions were attributed this week. This is a very small sample, and the Helen page’s 20 views cannot be treated as external traffic without filtering internal activity.
Recommended Actions
- Investigate Direct traffic increase and source tagging.
- Protect search discovery and review Organic decline.
- Review Vernon Square Mall page visibility.
- Measure gateway onward navigation.
- Exclude internal development and bot testing.
- Validate shopping-path events and reconcile channel totals.
Trend Tracker
| Signal | Status | Leadership read |
|---|---|---|
| Sessions | Improving | 382, +7.3% |
| New users | Improving | 275 vs 245 prior week |
| Direct | Strong | 155 vs 103 prior week |
| Shopping intent | Improving | 98 vs 92 Click-to-Shop |
| Organic Search | Watch | 220 vs 243 prior week |
| Attribution | Review | 385 channel rows vs 382 total |
Supporting GA4 Reports