
Weekly Performance Report
Stronger website discovery, rising Direct traffic and improved shopping intent.
Leadership takeaway
Week 34 recorded stronger traffic, new-user acquisition and shopping-path activity. Direct traffic grew sharply, the All Stores gateway topped page views, and Click-to-Shop increased to 98. These are positive digital signals, not proof of sales.
Weekly wins
- 382 sessions (▲ 7.3%) and 382 engaged sessions (▲ 7.3%).
- 305 active users and 275 new users (both above Week 33).
- 832 page views (up 105 from Week 33).
- 98 Click-to-Shop events from 71 users (up from 92 and 68).
- Direct sessions rose from 103 to 155; All Stores gateway rose from 69 to 102 views.
- Vernon, Harvey, Guisachan and Revelstoke all grew in page visibility.
Watch list
- Organic Search fell from 243 to 220 sessions, despite remaining the largest source.
- Vernon Square Mall dropped to 34 views from 49.
- GA4 channel rows total 385, three above the 382 headline.
- Helen page: 20 views from seven users; internal testing is a plausible contributor.
- The 100% key-event rate is not a purchase conversion rate.
| Metric | Week 34 | WoW change | Reading |
|---|---|---|---|
| Sessions | 382 | ▲ 7.3% | More visits; GA4 headline |
| Engaged sessions | 382 | ▲ 7.3% | 100% reported engagement rate; configuration-dependent |
| Active users | 305 | ▲ 10.1%* | Calculated vs Week 33: 277 |
| New users | 275 | ▲ 12.2%* | Calculated vs Week 33: 245 |
| Page views | 832 | ▲ 14.4%* | Calculated vs Week 33: 727 |
| Avg engagement / active user | 2m 03s | ▼ 2.6% | Slightly lower than 2m 07s |
| Total users | 309 | ▲ 10.0%* | Calculated vs Week 33: 281 |
| Total events | 2,521 | ▲ 10.6% | Home comparison card |
| Click-to-Shop | 98 | ▲ 6.5%* | 71 users; compared with 92 events |
| Key events | 2,366 | ▲ 11.8%* | Broad event configuration, not sales |
* Calculated from the exact Week 33 and Week 34 totals shown in the supplied report screenshots; not an independently shown comparison card. GA4 session channel rows sum to 385 versus the 382 headline, and their displayed shares sum above 100%; validate the acquisition export. All routine events designated as key events must not be treated as sales. Helen page activity may include development and testing.
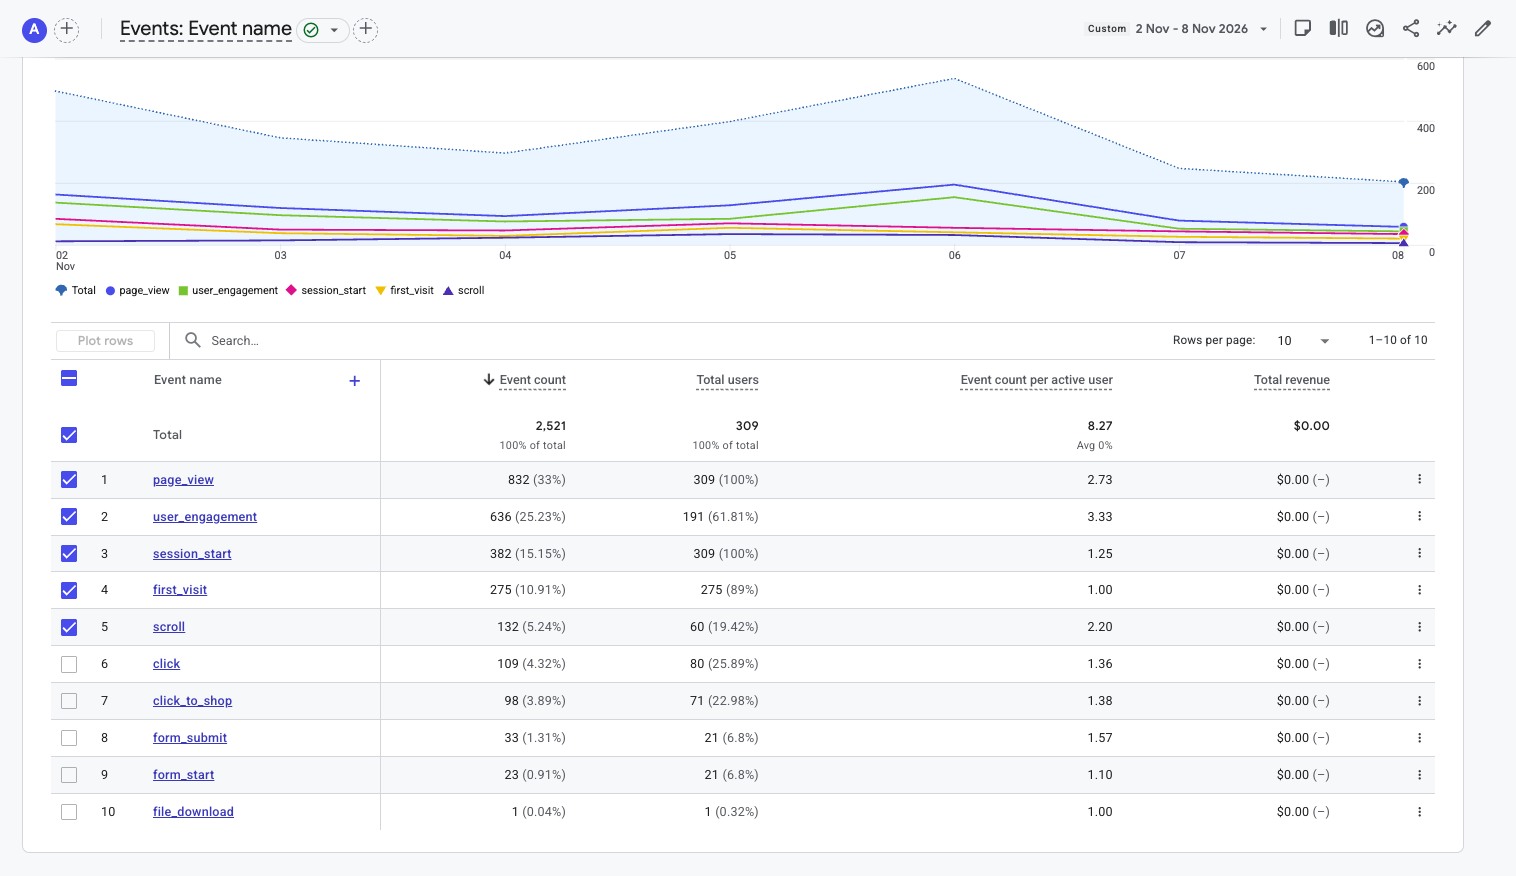
Across six store homepages, 372 views were recorded; adding the All Stores gateway yields 474 views (57.0% of all 832 views). Page-specific users overlap and must not be added.
| Page | Views | Active users | Avg time | Views WoW |
|---|---|---|---|---|
| ARC Liquor All Stores | 102 | 63 | 11s | ▲ 47.8%* |
| Harvey Avenue | 97 | 48 | 1m 03s | ▲ 10.2%* |
| Vernon 58th Avenue | 76 | 44 | 1m 19s | ▲ 26.7%* |
| Guisachan | 67 | 40 | 52s | ▲ 11.7%* |
| Glenmore | 56 | 25 | 0s | ▲ 3.7%* |
| Revelstoke | 42 | 20 | 1m 33s | ▲ 16.7%* |
| Vernon Square Mall | 34 | 22 | 23s | ▼ 30.6%* |
| Monthly Flyer | 33 | 9 | 0s | Not shown |
| Helen | 20 | 7 | 2m 43s | Not shown |
| Monthly Discounted Offers – Vernon | 16 | 10 | 1m 06s | Not shown |
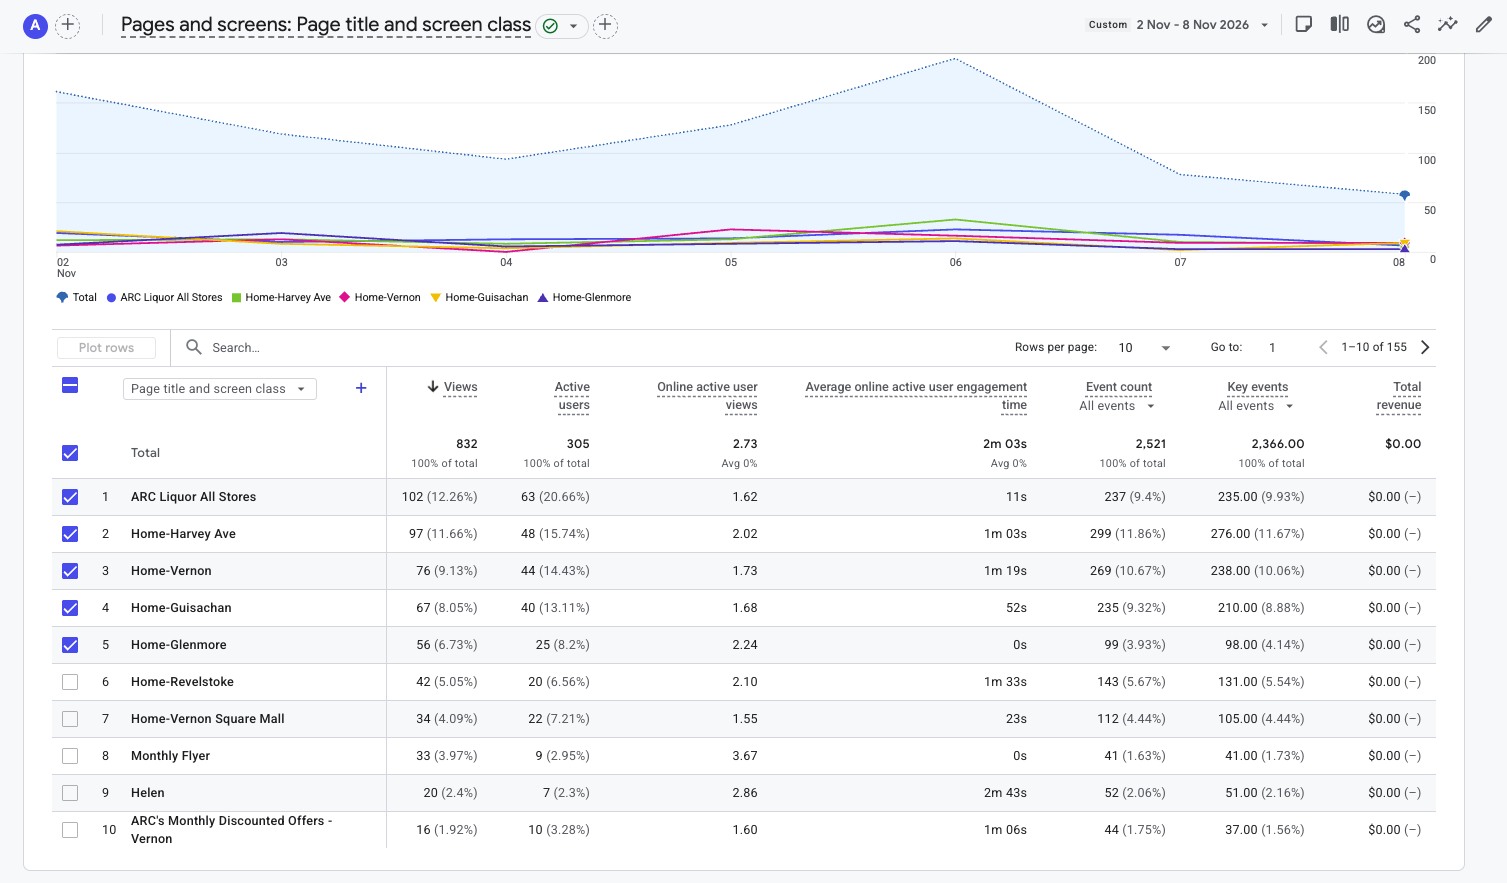
| Channel | Sessions | Share | Engaged | Avg engagement | WoW* |
|---|---|---|---|---|---|
| Organic Search | 220 | 57.59% | 220 | 1m 44s | ▼ 9.5%* |
| Direct | 155 | 40.58% | 155 | 1m 31s | ▲ 50.5%* |
| Referral | 4 | 1.05% | 4 | 29s | ▼ 42.9%* |
| Unassigned | 4 | 1.05% | 0 | 1m 45s | ▼ 33.3%* |
| AI Assistant | 2 | 0.52% | 2 | 49s | ▼ 33.3%* |
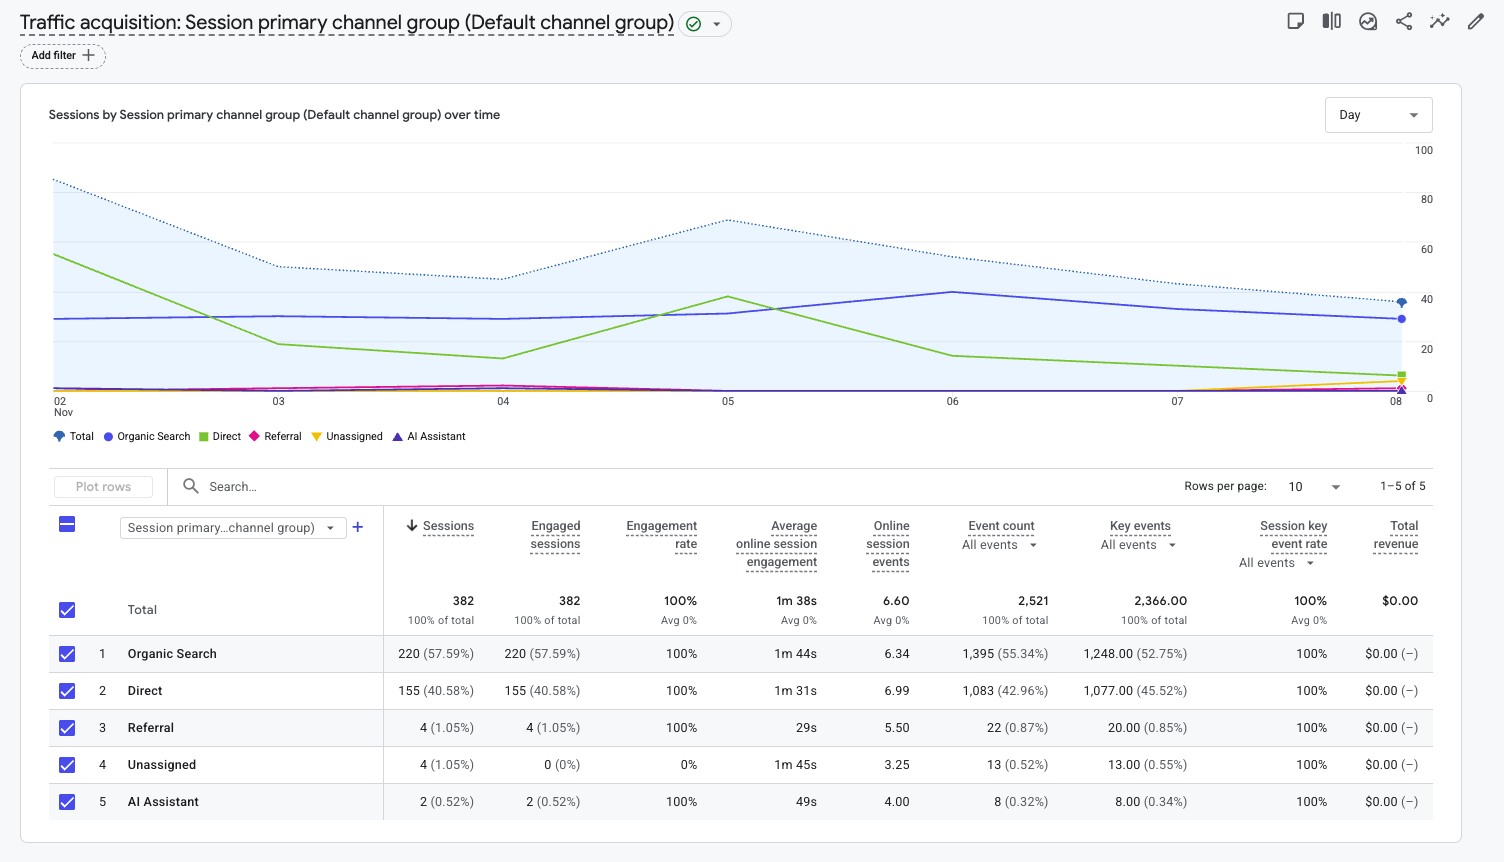
First-user acquisition: 275 new users: Organic Search 150, Direct 121, AI Assistant two and Referral two. GA4 reports 309 total users and 50 returning users. First-user channels should not be confused with sessions.
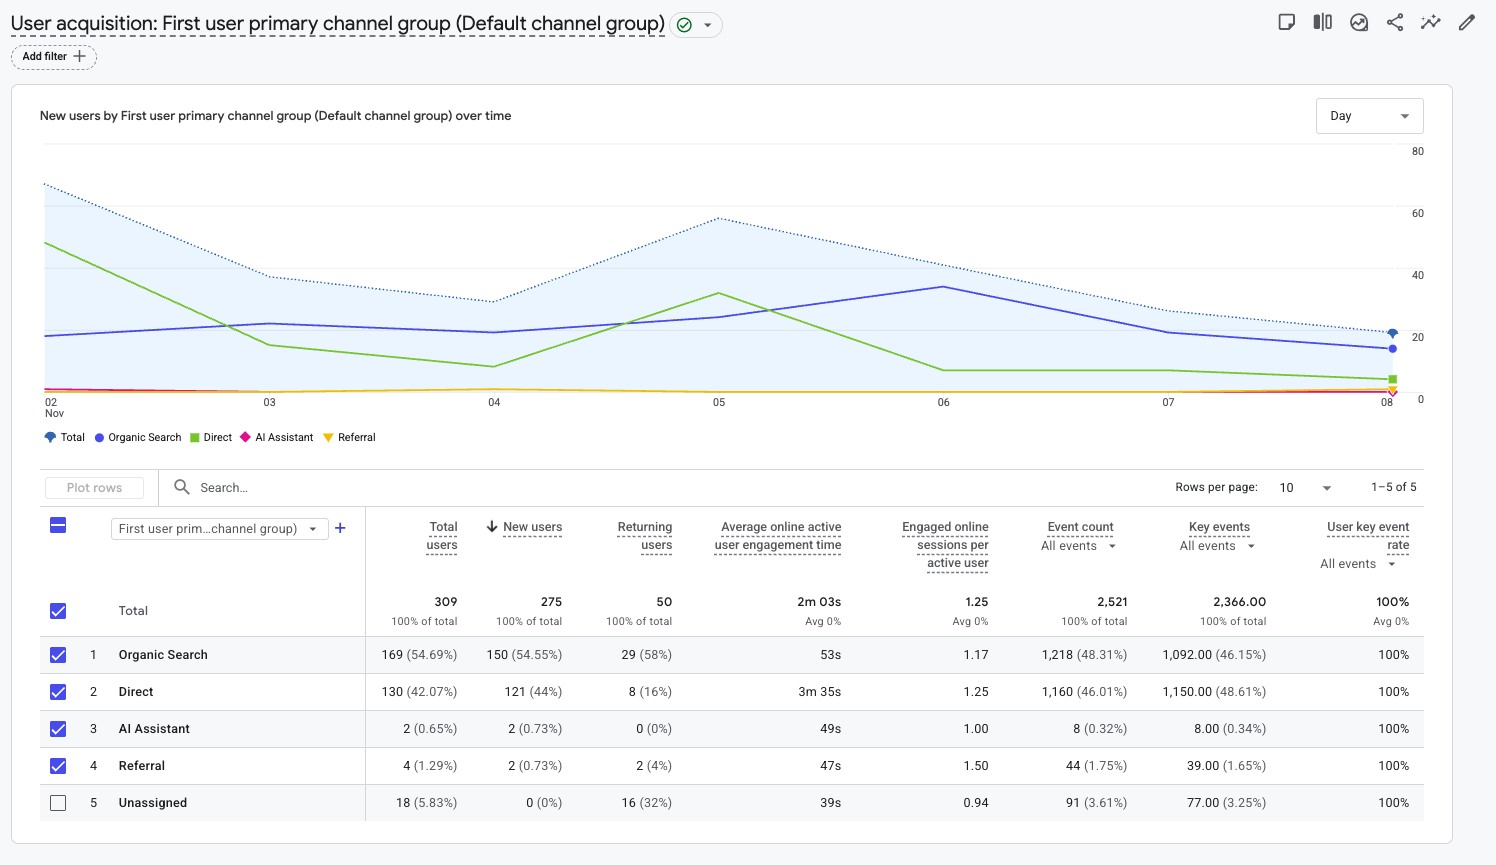
| Event | Count | Users | WoW* |
|---|---|---|---|
| page_view | 832 | 309 | ▲ 14.4%* |
| user_engagement | 636 | 191 | ▲ 15.8%* |
| session_start | 382 | 309 | ▲ 7.3%* |
| first_visit | 275 | 275 | ▲ 12.2%* |
| scroll | 132 | 60 | ▲ 3.9%* |
| click | 109 | 80 | ▼ 2.7%* |
| click_to_shop | 98 | 71 | ▲ 6.5%* |
| form_submit | 33 | 21 | ▼ 10.8%* |
| form_start | 23 | 21 | ▼ 28.1%* |
| file_download | 1 | 1 | Not shown |
| Measure | Week 34 | Meaning |
|---|---|---|
| Click-to-Shop | 98 events / 71 users | Shopping-path actions (+6.5%*) |
| Click-to-Product | Not displayed | Do not infer zero |
| Key events | 2,366 | Includes routine events; not purchases |
| Session key-event rate | 100% | Configuration-dependent |
| GA4 revenue | $0 | External and in-store purchases not established |
Click-to-Shop increased from 92 to 98 actions, a modest but useful directional improvement. The number of distinct users activating this event also increased from 68 to 71.
- Investigate Direct traffic growth and ensure campaigns and referrals are tagged consistently.
- Review Organic Search landing pages after the decline from 243 to 220 sessions.
- Measure All Stores gateway onward navigation and store-selection clicks.
- Review Vernon Square Mall visibility and discovery.
- Exclude internal and development activity from future GA4 measurement, particularly Helen testing.
- Reconcile 385 acquisition-row sessions against the 382 headline.
- Validate clicks, forms and shopping-path actions against real enquiries and confirmed downstream orders.
Week 34 recorded stronger traffic, new-user acquisition and shopping-path activity. Direct traffic grew sharply, the All Stores gateway topped page views, and Click-to-Shop increased to 98. These are positive digital signals, not proof of sales.
“A stronger audience, wider store discovery and more shopping actions give ARC positive momentum entering November.”
Source & comparison notes
* Calculated from the exact Week 33 and Week 34 totals shown in the supplied report screenshots; not an independently shown comparison card. GA4 session channel rows sum to 385 versus the 382 headline, and their displayed shares sum above 100%; validate the acquisition export. All routine events designated as key events must not be treated as sales. Helen page activity may include development and testing.
No assertion is made about future ARC budget decisions or continuity of services. Source: screenshots November 2–8, 2026. Report URLs are intended publication destinations, not verified live URLs.
GA4 Glossary
Sessions: website visits; distinct from event count. Active users: weekly active audience. New users: first visits. Engagement: measured active time. Click-to-Shop: shopping-path intent, not completed sales. Key events: selected events, including routine actions here. Attribution: first-user and session channels differ.