
Weekly Performance Report
Audience recovery, renewed shopping-path activity, and practical measurement context.
Leadership takeaway
Week 33 returned to positive growth: 356 sessions (▲ 12.7%), 277 active users (▲ 16.4%), 245 new users (▲ 16.1%), and 727 page views (▲ 17.4%). Click-to-Shop increased to 92 actions (▲ 22.7%) from 68 users.
Direct traffic expanded 27.2%, Organic Search improved 12.5%, and the All Stores gateway, Revelstoke, Glenmore, and Vernon Square Mall all gained views.
Weekly wins
- Sessions, engaged sessions, active users, new users and page views all rose.
- Click-to-Shop recovered to 92 events from 68 users.
- Organic Search delivered 243 sessions (▲ 12.5%).
- Direct delivered 103 sessions (▲ 27.2%).
- Revelstoke +80%, Glenmore +28.6%, and All Stores gateway +35.3%.
Watch list
- Average engagement per active user declined 75% from last week's exceptionally high reading.
- Prior-week activity and current 5m 38s Harvey engagement may be affected by internal page development and testing; investigate before attributing to customer behaviour.
- AI Assistant traffic fell to three sessions; very small sample.
- GA4 key events still include routine actions; not a sales measure.
- Displayed acquisition rows total 362 sessions vs the 356 headline.
| Metric | Week 33 | WoW change | Reading |
|---|---|---|---|
| Sessions | 356 | ▲ 12.7% | Reach rebounded |
| Active users | 277 | ▲ 16.4% | Broader weekly audience |
| New users | 245 | ▲ 16.1% | Discovery strengthened |
| Engaged sessions | 356 | ▲ 13.4% | 100% reported engagement rate; configuration-sensitive |
| Page views | 727 | ▲ 17.4% | 2.62 views / active user |
| Avg. engagement / active user | 2m 07s | ▼ 75.0% | Prior-week reading likely affected by internal testing |
| Total users | 281 | Not shown | User Acquisition total |
| Total events | 2,280 | ▲ 22.1% | All tracked event types |
| Click-to-Shop | 92 | ▲ 22.7% | 68 users; shopping-path actions, not purchases |
| Click-to-Product | Not in top 10 | Not shown | Do not interpret as zero |
| Key events | 2,116 | Not shown | Broad key-event configuration; not sales |
Comparisons come from the supplied GA4 comparison cards. “Not shown” means no comparison was supplied. Sessions and session_start are separate measures.
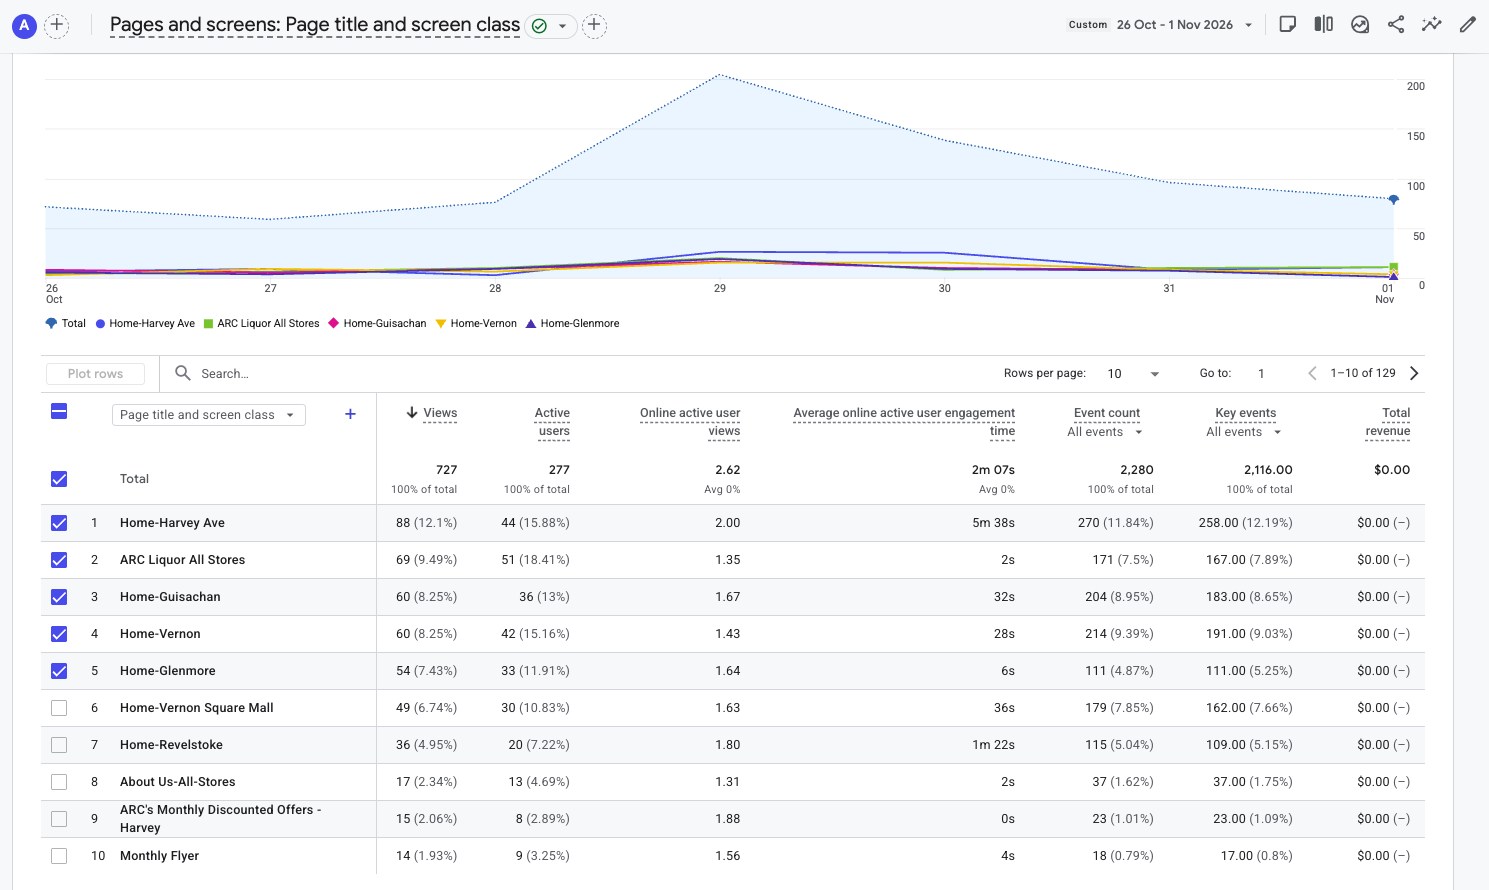
The six store homepages recorded 347 views; adding the All Stores gateway yields 416 views (57.2% of 727). Users overlap across pages and should not be added.
| Page | Views | Active users | Avg time | Views WoW |
|---|---|---|---|---|
| Harvey Avenue | 88 | 44 | 5m 38s | ▼ 19.3% |
| Vernon 58th Avenue | 60 | 42 | 28s | ▼ 14.3% |
| Guisachan | 60 | 36 | 32s | 0.0% |
| ARC Liquor All Stores | 69 | 51 | 2s | ▲ 35.3% |
| Glenmore | 54 | 33 | 6s | ▲ 28.6% |
| Vernon Square Mall | 49 | 30 | 36s | ▲ 14.0% |
| Revelstoke | 36 | 20 | 1m 22s | ▲ 80.0% |
| About Us – All Stores | 17 | 13 | 2s | Not shown |
| Monthly Discounted Offers – Harvey | 15 | 8 | 0s | Not shown |
| Monthly Flyer | 14 | 9 | 4s | Not shown |
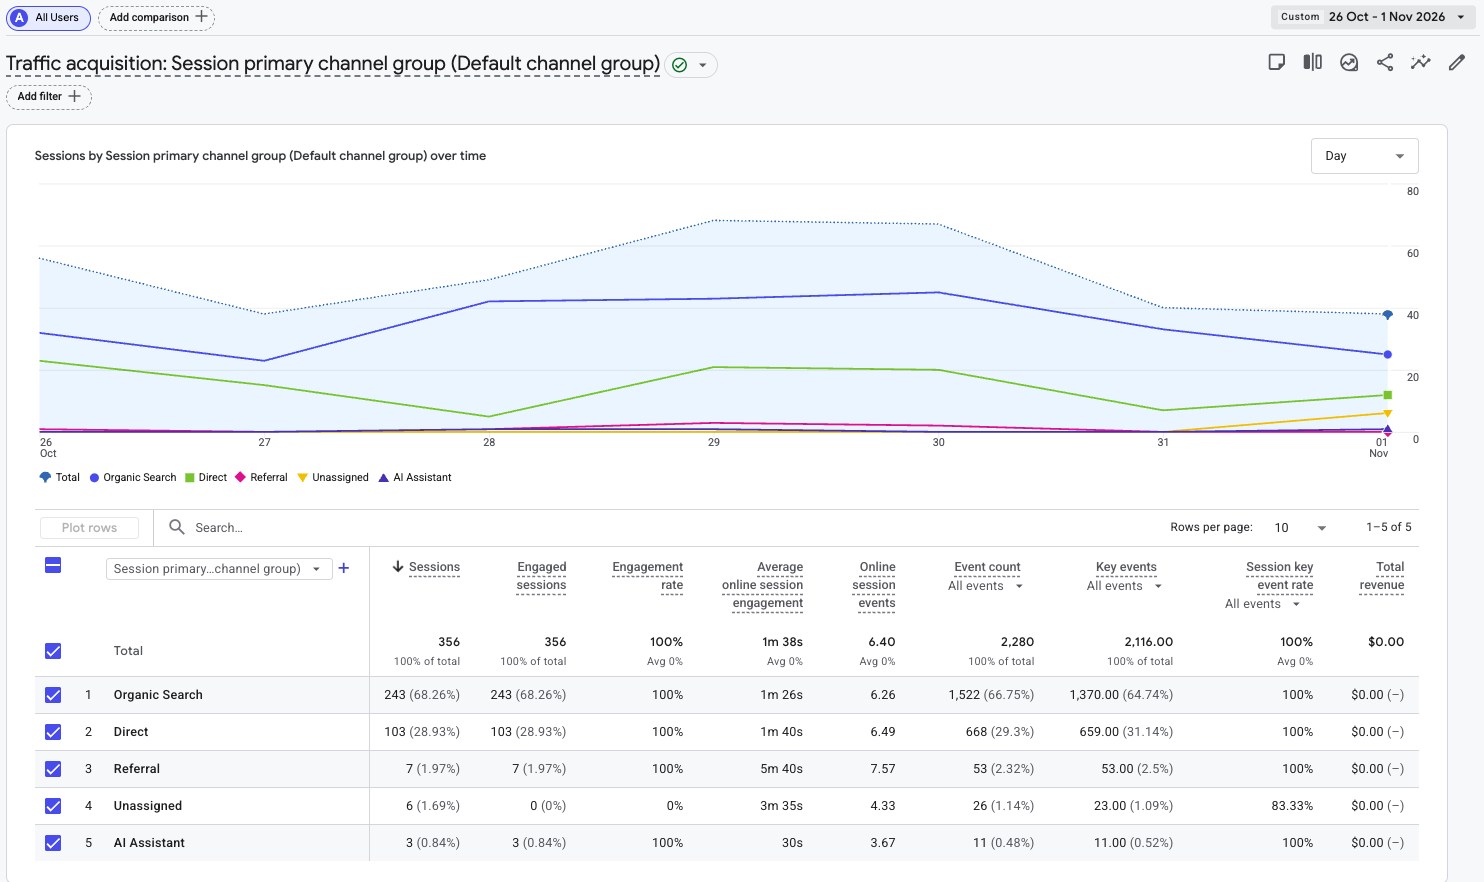
| Channel | Sessions | Share | Engaged | Avg engagement | WoW |
|---|---|---|---|---|---|
| Organic Search | 243 | 68.26% | 243 | 1m 26s | ▲ 12.5% |
| Direct | 103 | 28.93% | 103 | 1m 40s | ▲ 27.2% |
| Referral | 7 | 1.97% | 7 | 5m 40s | ▼ 46.2% |
| Unassigned | 6 | 1.69% | 0 | 3m 35s | ▲ 200.0% |
| AI Assistant | 3 | 0.84% | 3 | 30s | ▼ 25.0% |
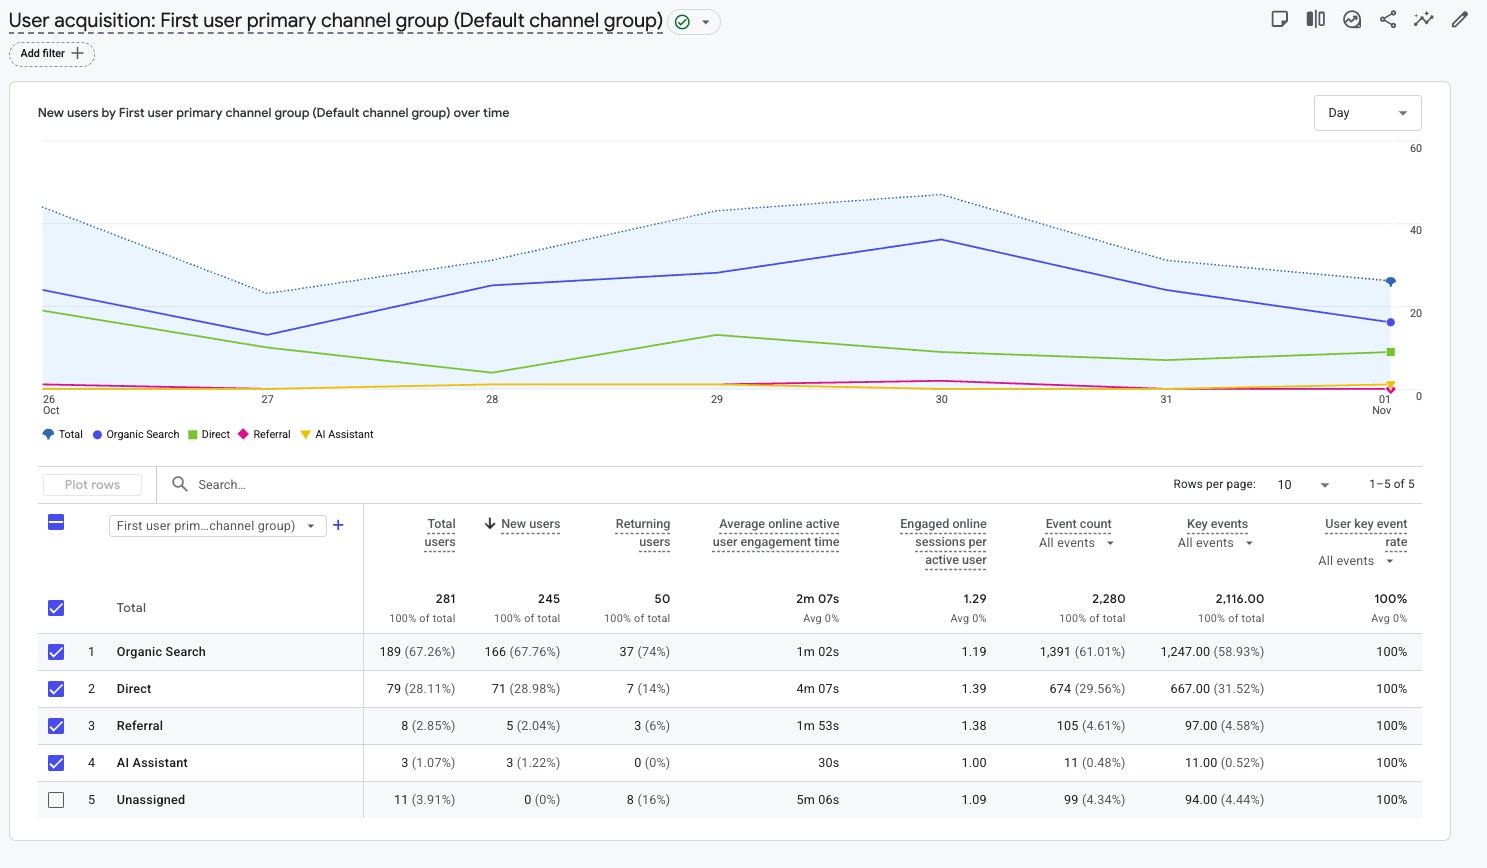
First-user acquisition: 245 new users; Organic 166, Direct 71, Referral five, AI Assistant three. The report also lists 281 total users and 50 returning users. Session and first-user attribution are different scopes.
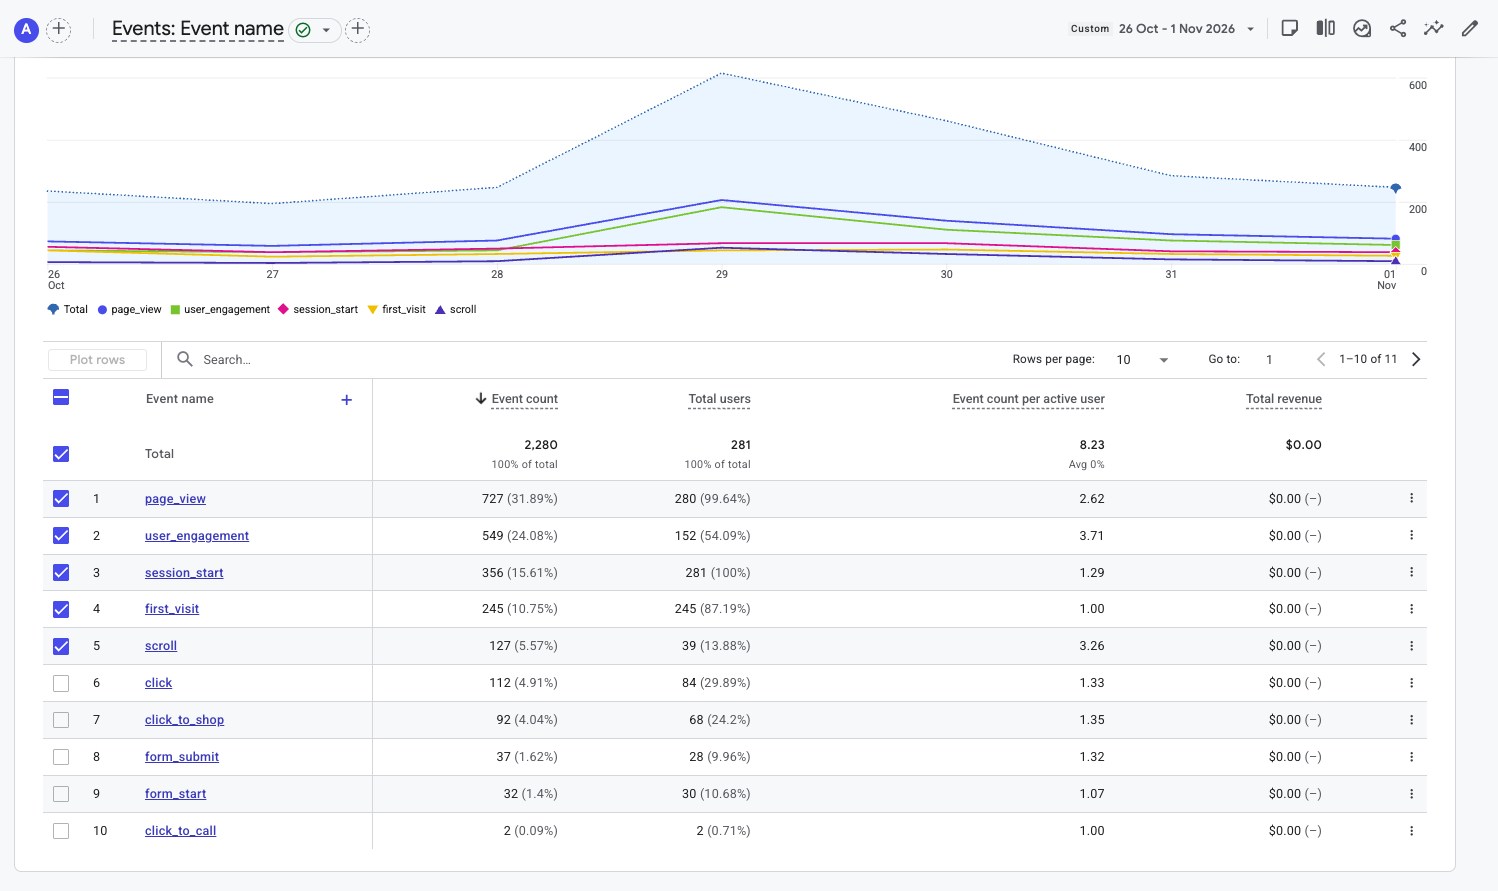
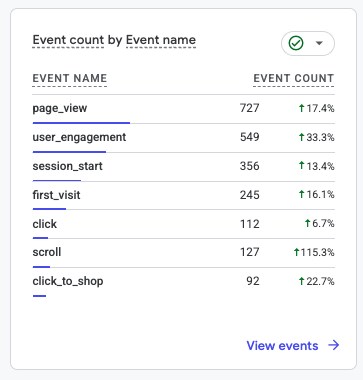
| Event | Count | Users | WoW |
|---|---|---|---|
| page_view | 727 | 280 | ▲ 17.4% |
| user_engagement | 549 | 152 | ▲ 33.3% |
| session_start | 356 | 281 | ▲ 13.4% |
| first_visit | 245 | 245 | ▲ 16.1% |
| scroll | 127 | 39 | ▲ 115.3% |
| click | 112 | 84 | ▲ 6.7% |
| click_to_shop | 92 | 68 | ▲ 22.7% |
| form_submit | 37 | 28 | Not shown |
| form_start | 32 | 30 | Not shown |
| click_to_call | 2 | 2 | Not shown |
| Measure | Week 33 | Interpretation |
|---|---|---|
| Click-to-Shop | 92 events / 68 users | ▲ 22.7%; outbound shopping-path intent |
| Click-to-Product | Not shown in first ten | Not zero; not visible in provided top-ten rows |
| Key events | 2,116 | Routine events included; not purchases |
| Session key-event rate | 100% | Configuration-dependent |
| GA4 revenue | $0 | Does not establish offline or external sales |
Click-to-Shop rose from 75 to 92, while store visits and visibility also improved. These are intent actions; the screenshots do not establish a completed retail transaction.
- Keep momentum: review organic and direct landing pages contributing to recovered traffic.
- Protect intent: monitor Click-to-Shop and downstream shopping outcomes rather than assuming sales.
- Exclude internal traffic: establish GA4 internal/developer traffic filtering and validate anomalous engagement readings.
- Reconcile channel rows: resolve 362 vs 356 sessions before using channel share in decisions.
- Track store gateways: verify whether short engagement reflects quick onward store-selection clicks.
- Validate forms: check event duplication, true leads and the completion funnel.
- Observe AI carefully: low session count does not support strong trend claims.
Week 33 brought visitors and shopping-path activity back into growth, while last week's unusually high engagement measurement returned toward normal.
“More visitors discovered ARC, and more took the next step toward shopping.”
Source & comparison notes
ARC GA4 screenshots, October 26–November 1, 2026, compared with October 19–25. Weekly engagement decline is affected by comparison against an anomalously elevated prior week; internal influence is suspected but not quantified. The displayed traffic-acquisition channel rows exceed headline sessions by six. GA4 key events are not completed sales.
GA4 Glossary
Active users: weekly active audience. Sessions: visits, distinct from session_start. Engagement: active time and engaged sessions measure different things. Shopping intent: outbound shopping clicks are not sales. Key events: GA4 events marked as important, including routine events in this property. Attribution: user and session channel definitions differ.