
Weekly Performance Report
Lower reach. Deeper engagement. Stronger AI Assistant acquisition.
Leadership takeaway
Week 30 saw 327 sessions (▼ 24.0%), 245 active users (▼ 27.5%) and 216 new users (▼ 29.9%). At the same time, average engagement per active user rose to 1m 24s (▲ 46.5%).
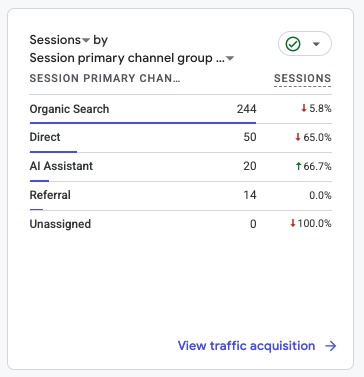
Organic Search remained ARC's largest traffic source, while Direct experienced the sharpest decline. AI Assistant supplied 20 sessions (▲ 66.7%), averaging 6m 48s of engagement per session.
Weekly wins
- Average engagement per active user improved 46.5%.
- AI Assistant sessions rose 66.7% to 20, with extended engagement.
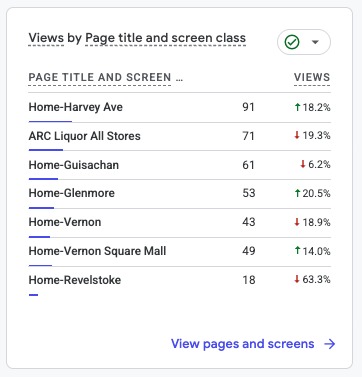
- Harvey page views rose 18.2% to 91; Glenmore rose 20.5% to 53.
- Vernon Square Mall rose 14.0% to 49 and averaged 1m 06s engagement per active user.
- Click-to-Product recorded 10 actions from seven users, versus seven events last week.
Watch list
- Sessions fell 24.0%, with Direct down 65.0%.
- New users declined 29.9% and page views fell 18.8%.
- Click-to-Shop declined 8.8% to 103 actions.
- Revelstoke page views declined 63.3% to 18.
- Engagement and key-event rates need contextual interpretation because routine GA4 events are configured as key events.
| Metric | Week 30 | WoW change | Reading |
|---|---|---|---|
| Sessions | 327 | ▼ 24.0% | Fewer visits |
| Active users | 245 | ▼ 27.5% | Smaller weekly audience |
| New users | 216 | ▼ 29.9% | Slower acquisition |
| Engaged sessions | 327 | ▼ 23.8% | All 327 sessions classed engaged |
| Page views | 643 | ▼ 18.8% | 2.62 per active user |
| Avg. engagement / active user | 1m 24s | ▲ 46.5% | Per-session average: 1m 02s |
| Total users | 249 | Not shown | User Acquisition total |
| Total events | 2,042 | Not shown | 8.33 events per active user |
| Click-to-Shop | 103 | ▼ 8.8% | 61 users |
| Click-to-Product | 10 | Not shown | 7 users |
| Key events | 1,870 | Not shown | Broad configuration; not sales |
▲ and ▼ indicate direction. “Not shown” means the supplied comparison cards do not show a week-over-week percentage. Sessions and session_start are different GA4 metrics.
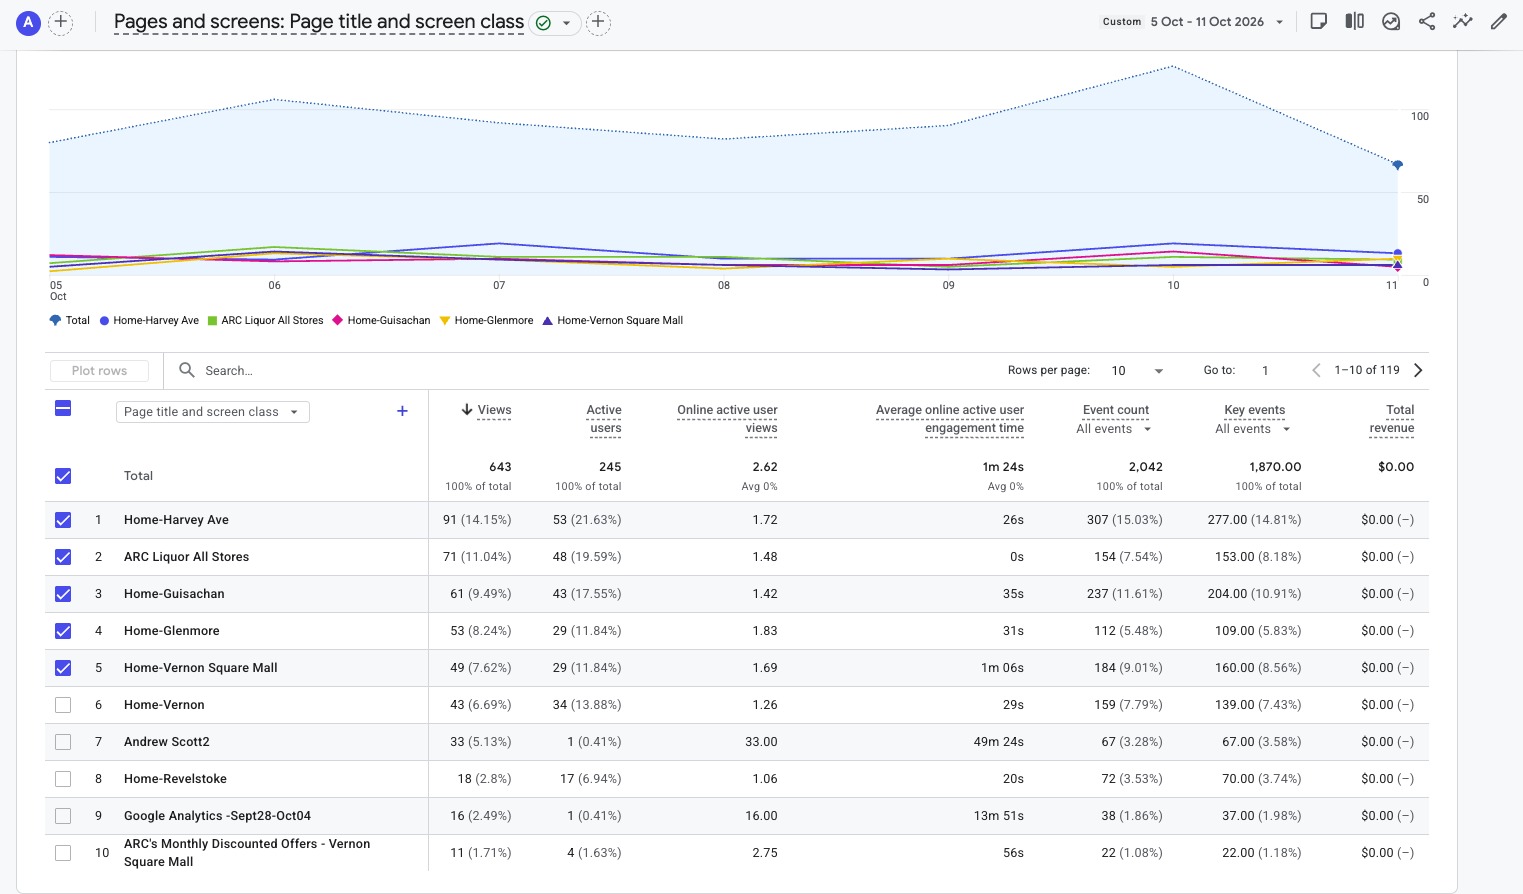
The six store homepages recorded 315 views; adding the All Stores gateway produces 386 views, about 60.0% of all 643 page views. Users overlap across pages and must not be summed.
| Page | Views | Active users | Avg. engagement | Views WoW |
|---|---|---|---|---|
| Harvey Avenue | 91 | 53 | 26s | ▲ 18.2% |
| ARC Liquor All Stores | 71 | 48 | 0s | ▼ 19.3% |
| Guisachan | 61 | 43 | 35s | ▼ 6.2% |
| Glenmore | 53 | 29 | 31s | ▲ 20.5% |
| Vernon Square Mall | 49 | 29 | 1m 06s | ▲ 14.0% |
| Vernon 58th Avenue | 43 | 34 | 29s | ▼ 18.9% |
| Andrew Scott2 | 33 | 1 | 49m 24s | Not shown |
| Revelstoke | 18 | 17 | 20s | ▼ 63.3% |
| Google Analytics - Sept28-Oct04 | 16 | 1 | 13m 51s | Not shown |
| ARC's Monthly Discounted Offers - Vernon Square Mall | 11 | 4 | 56s | Not shown |
Andrew Scott2 recorded 33 views but only one active user, with 49m 24s average engagement; this may reflect internal development or testing and should not be presented as verified customer interest. The Google Analytics report page likewise has one active user.
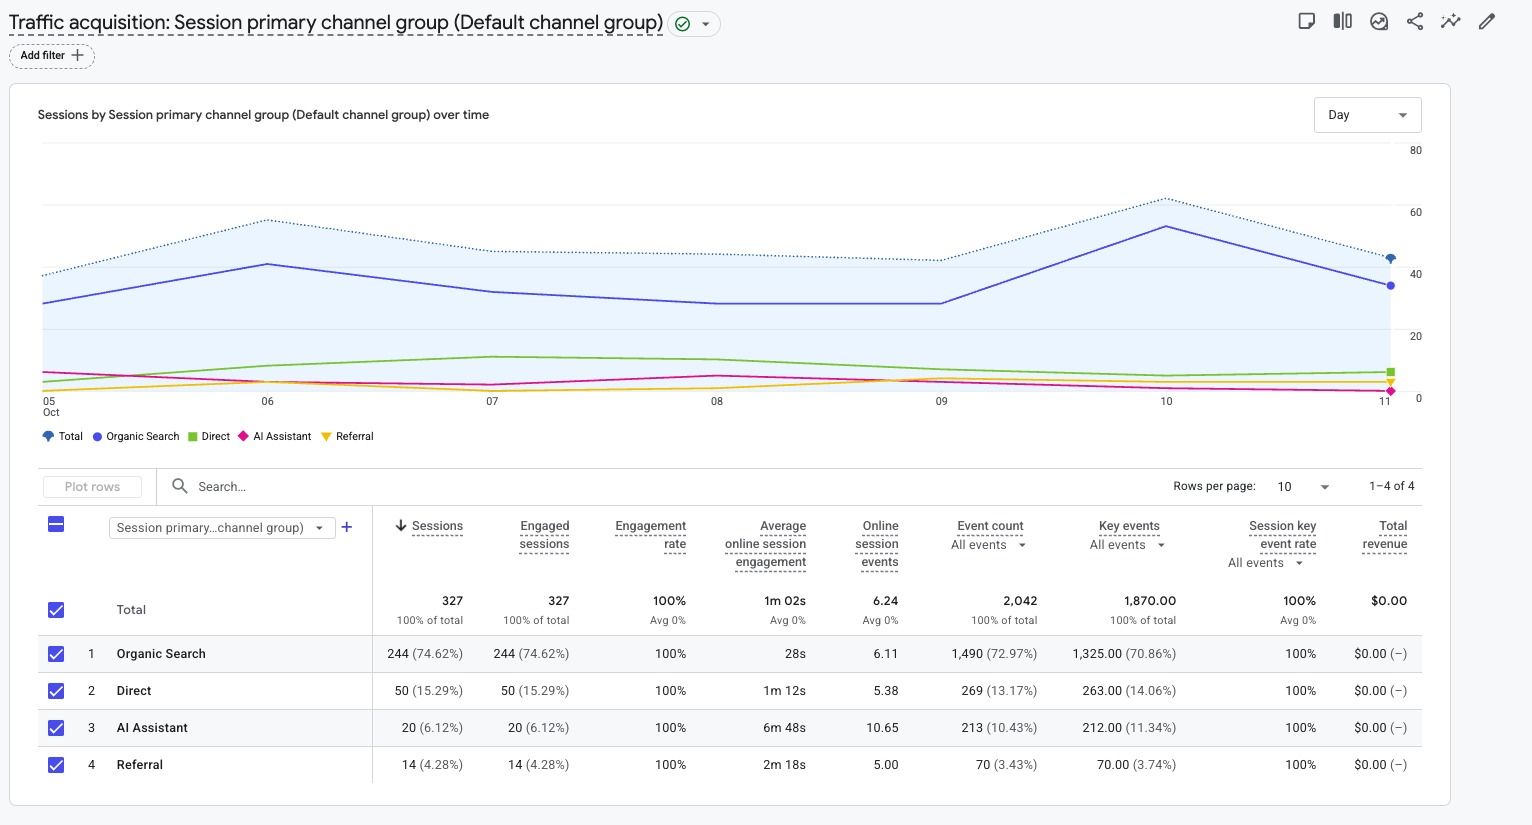
| Channel | Sessions | Share | Engaged | Avg. engagement | Sessions WoW |
|---|---|---|---|---|---|
| Organic Search | 244 | 74.62% | 244 | 28s | ▼ 5.8% |
| Direct | 50 | 15.29% | 50 | 1m 12s | ▼ 65.0% |
| AI Assistant | 20 | 6.12% | 20 | 6m 48s | ▲ 66.7% |
| Referral | 14 | 4.28% | 14 | 2m 18s | 0.0% |
Organic Search provided 74.62% of sessions, down 5.8% week over week. Direct declined to 50 sessions (▼ 65.0%) and appears to explain much of the overall traffic decline. AI Assistant rose to 20 sessions (▲ 66.7%) and averaged 6m 48s, although its sample remains small. The four channel rows reconcile to 328 rather than the 327-session headline? No: 244 + 50 + 20 + 14 = 328. The discrepancy is one session and warrants confirmation from a fresh export; the report reproduces GA4 exactly.
First-time discovery
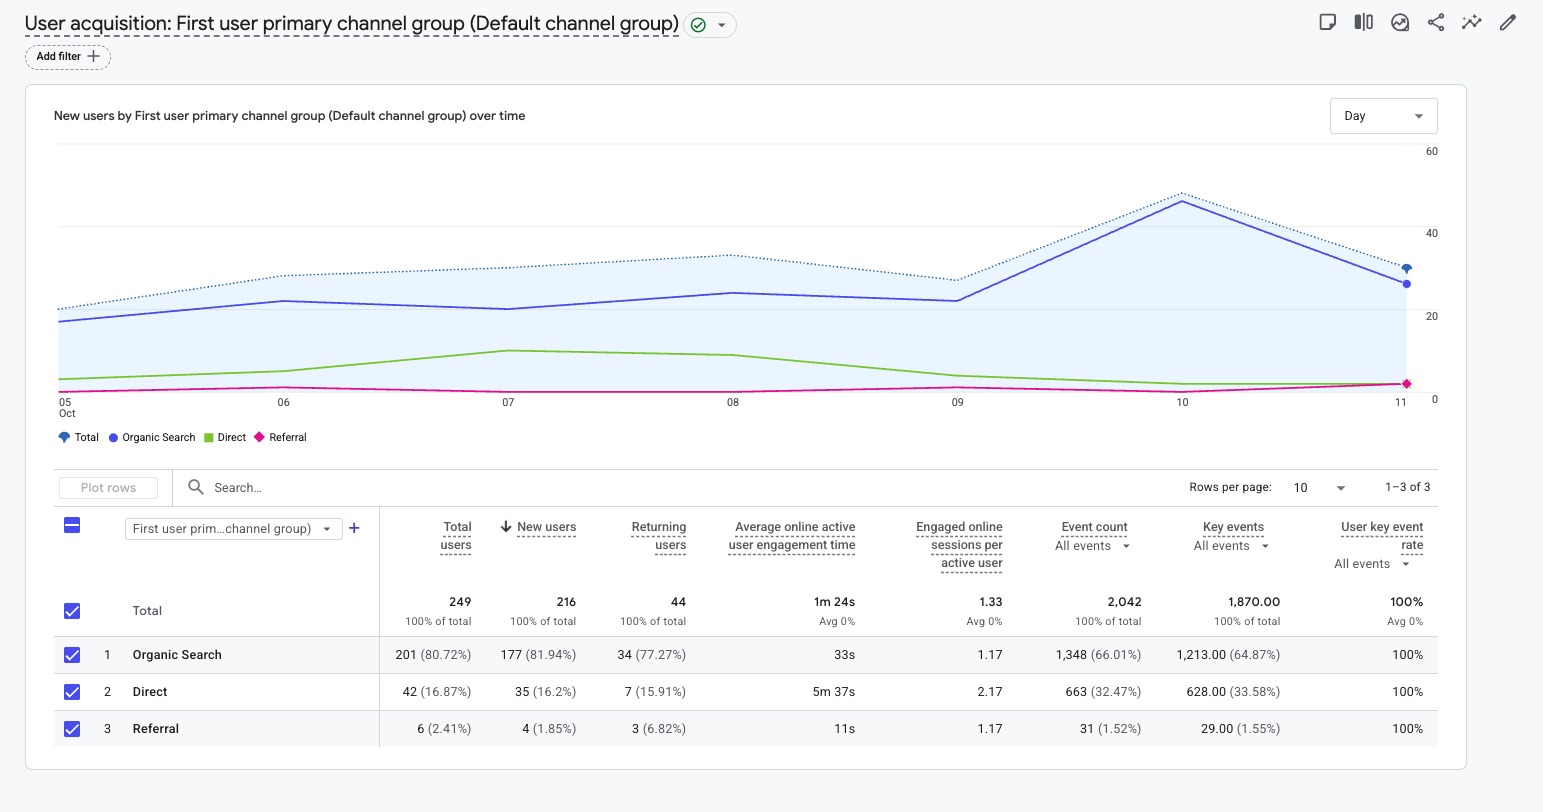
GA4 User Acquisition shows 216 new users: 177 Organic Search, 35 Direct and four Referral. Total users were 249; 44 returning users. First-user and session acquisition represent different scopes.
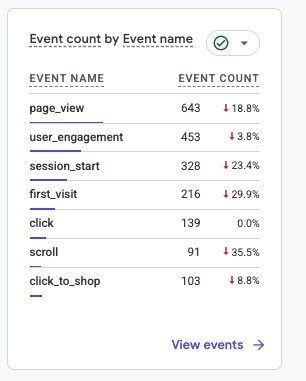
| Event | Count | Total users | Count WoW |
|---|---|---|---|
| page_view | 643 | 249 | ▼ 18.8% |
| user_engagement | 453 | 157 | ▼ 3.8% |
| session_start | 328 | 249 | ▼ 23.4% |
| first_visit | 216 | 216 | ▼ 29.9% |
| click | 139 | 87 | 0.0% |
| click_to_shop | 103 | 61 | ▼ 8.8% |
| scroll | 91 | 45 | ▼ 35.5% |
| form_submit | 30 | 22 | Not shown |
| form_start | 25 | 24 | Not shown |
| click_to_product | 10 | 7 | Not shown |
Page views declined 18.8%, but user_engagement events declined only 3.8%, consistent with the increase in average engagement time. Click-to-Shop declined 8.8% to 103, while click remained essentially flat at 139 events. Scroll fell 35.5%. The top 10 of 12 event types are shown; no prior comparison is supplied for form or product-click events.
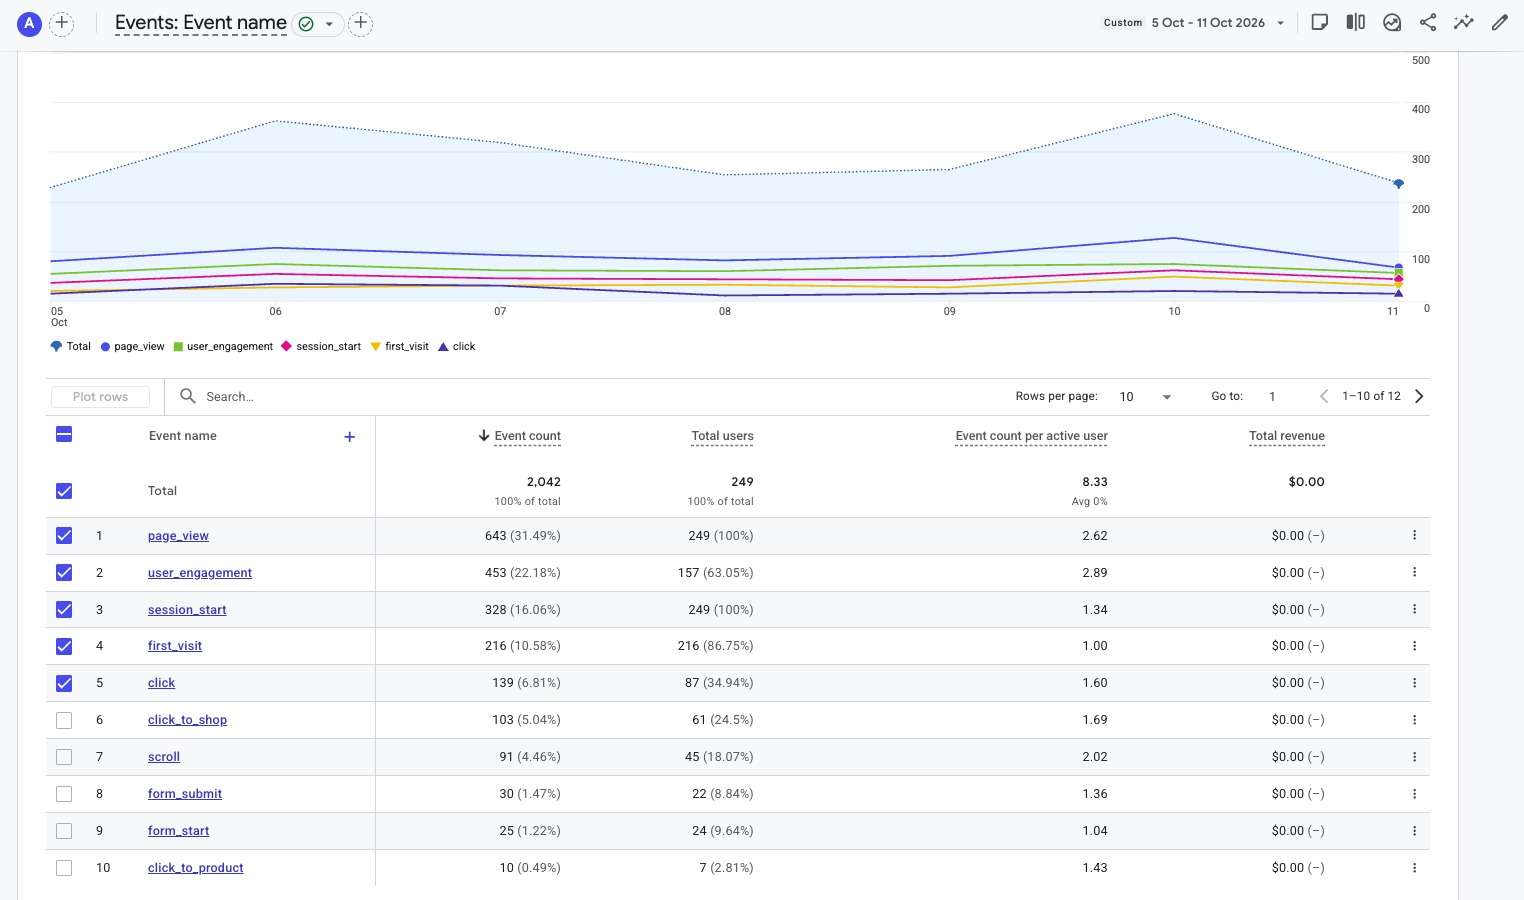
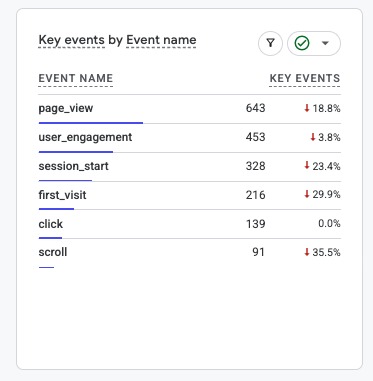
Click-to-Shop recorded 103 events across 61 users, and Click-to-Product recorded 10 events across seven users. These are actions toward shopping, not completed orders. The 1,870 GA4 key events and the 100% session key-event rate must not be interpreted as purchases because routine page_view and session_start events are also marked as key events.
| Measure | Week 30 | Meaning |
|---|---|---|
| Click-to-Shop | 103 / 61 users | ▼ 8.8%; shopping pathway |
| Click-to-Product | 10 / 7 users | Product-level intent; prior count was 7 |
| Key events | 1,870 | Broad configuration; not sales |
| Session key-event rate | 100% | Not a purchase-conversion rate |
| GA4 revenue | $0 | Does not exclude sales elsewhere |
- Investigate Direct traffic: review traffic sources, tagging and referral paths behind the ▼ 65.0% reduction.
- Protect Organic Search: identify landing pages and queries behind the smaller ▼ 5.8% decline.
- Assess AI Assistant journeys: compare the 20 deeply engaged sessions with meaningful product and shop actions.
- Support Revelstoke: inspect store-page search visibility and navigation after its sharp view decline.
- Evaluate high-performing store pages: maintain Harvey, Glenmore and Vernon Square Mall momentum.
- Separate development traffic: filter or annotate internal testing of Andrew Scott2 and internal report pages.
- Confirm measurement: recheck the one-session source-row discrepancy and verify key-event definitions.
Week 30 traded audience size for deeper engagement. Traffic and new-user acquisition declined, particularly through Direct, but visitors who engaged spent more time. AI Assistant sessions increased and remained unusually deep, while Click-to-Shop fell less sharply than overall traffic.
“Fewer visitors arrived this week, but those who engaged stayed longer — and AI Assistant traffic continued to show its value.”
Source & comparison notes
Source: ARC GA4 screenshots October 5–11, 2026; comparison period September 28–October 4, 2026. Displayed report totals take precedence over inferred figures. No completed-sales claim is made.
GA4 Glossary
Active users
Visitors who engaged with ARC during the period.
Sessions
Site visits; distinct from session_start events.
Engagement
Active time and qualified sessions use different measures.
Shopping intent
Click-to-Shop and Click-to-Product track actions, not confirmed orders.
Key events
GA4 events marked as important; currently includes routine actions.
Acquisition
User acquisition and session acquisition use different attribution scopes.