Enhanced Leadership Performance Report
Customer acquisition, engagement quality and shopping-path behaviour across ARC's digital network.
ARC Digital Scorecard
Editorial assessment only; not a GA4 metric. Lower reach offsets the improvement in engagement quality.
| Area | Status | Leadership reading |
|---|---|---|
| Reach | Watch | Sessions ▼ 24.0% |
| Engagement depth | Improving | 1m 24s per user ▲ 46.5% |
| AI Assistant | Improving | 20 sessions ▲ 66.7% |
| Shopping intent | Watch | 103 shop clicks ▼ 8.8% |
| Attribution | Review | Channel rows exceed headline by 1 |
Weekly Wins
- Engagement per active user rose 46.5%.
- AI Assistant traffic rose 66.7% to 20 sessions.
- Harvey, Glenmore and Vernon Square Mall page views improved.
- Click-to-Product reached 10 events versus 7 last week.
Watch List
- Sessions down 24.0%, with Direct down 65.0%.
- New-user acquisition down 29.9%.
- Revelstoke views down 63.3%.
- Shop actions down 8.8%; key-event settings remain broad.
Week 30: Reach Declined; Engagement Deepened
ARC attracted fewer visitors, but average online active user engagement time improved markedly. Traffic quality should be measured through actual product interaction and shopping actions rather than the inflated session key-event rate.
KPI Performance Overview
| Metric | Week 30 | WoW | Reading |
|---|---|---|---|
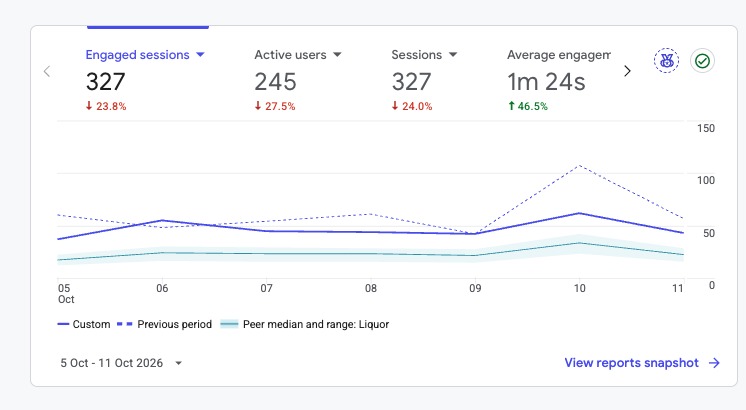
| Sessions | 327 | ▼ 24.0% | Fewer visits |
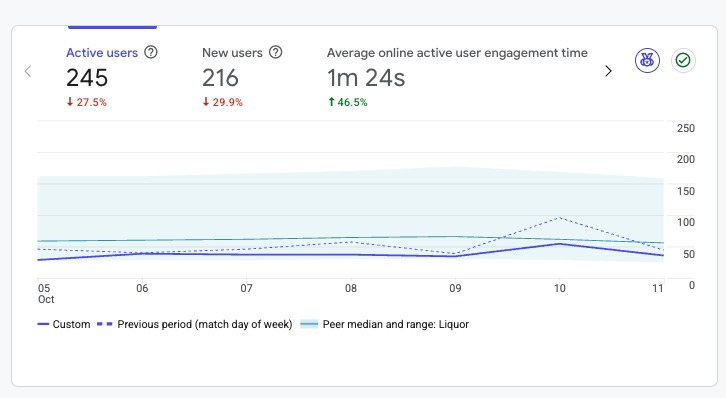
| Active users | 245 | ▼ 27.5% | Smaller weekly audience |
| New users | 216 | ▼ 29.9% | Slower acquisition |
| Engaged sessions | 327 | ▼ 23.8% | All 327 sessions classed engaged |
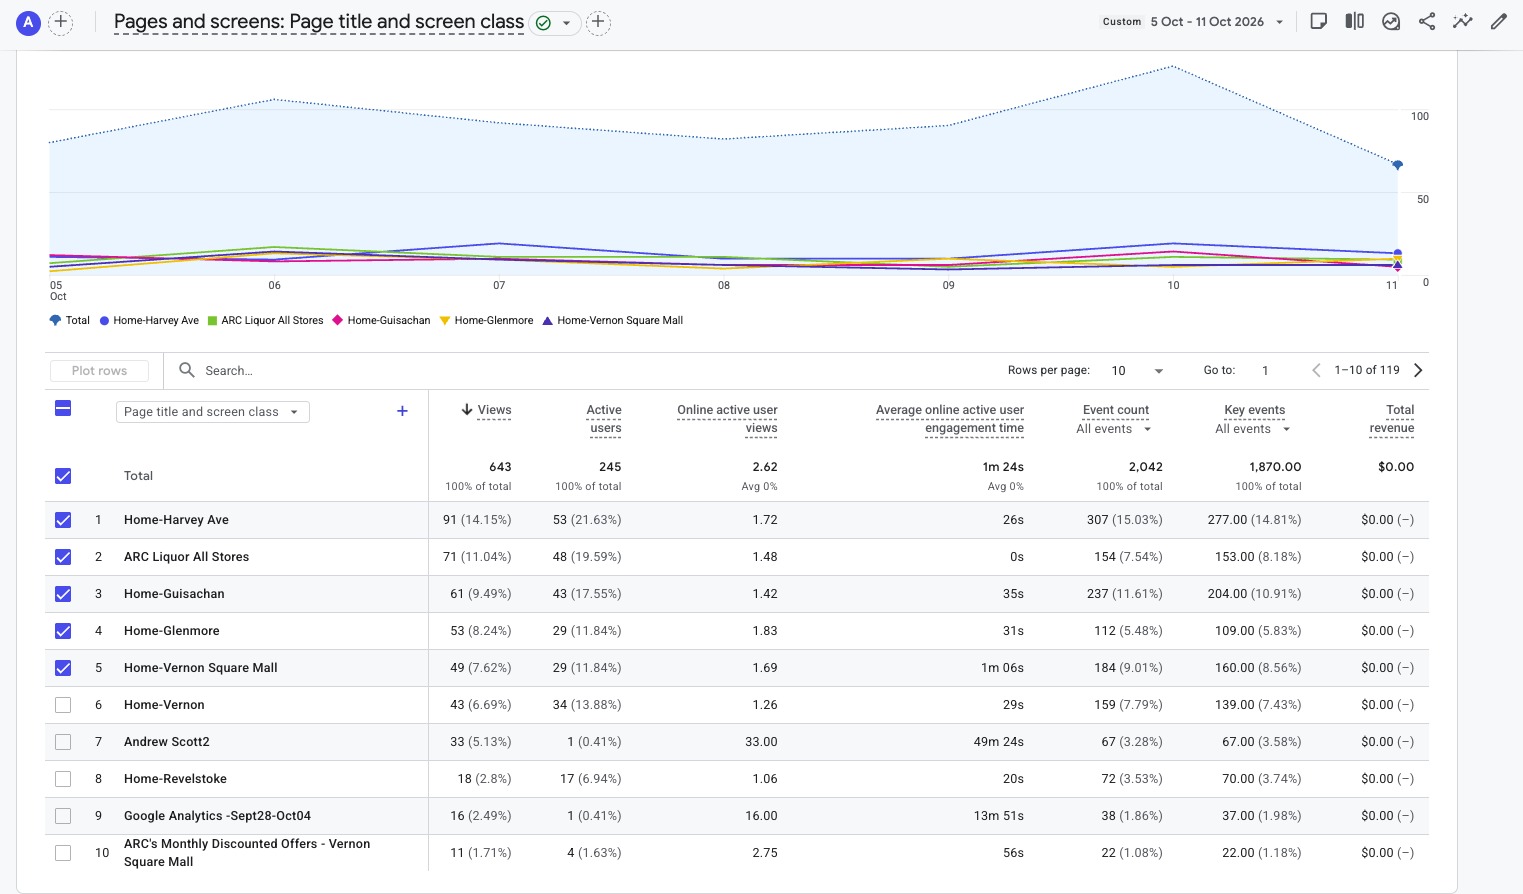
| Page views | 643 | ▼ 18.8% | 2.62 per active user |
| Avg. engagement / active user | 1m 24s | ▲ 46.5% | Per-session average: 1m 02s |
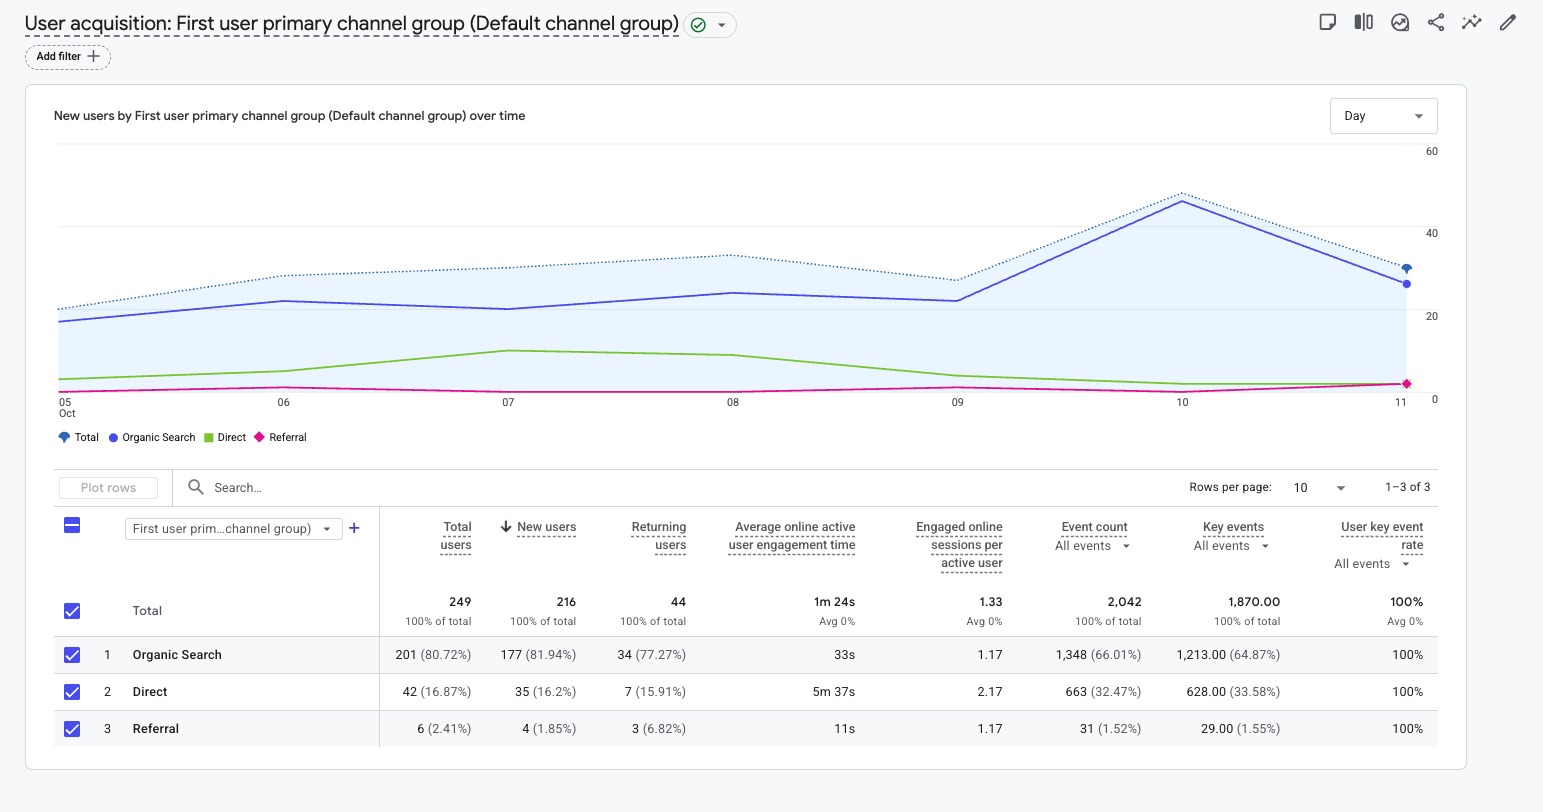
| Total users | 249 | Not shown | User Acquisition total |
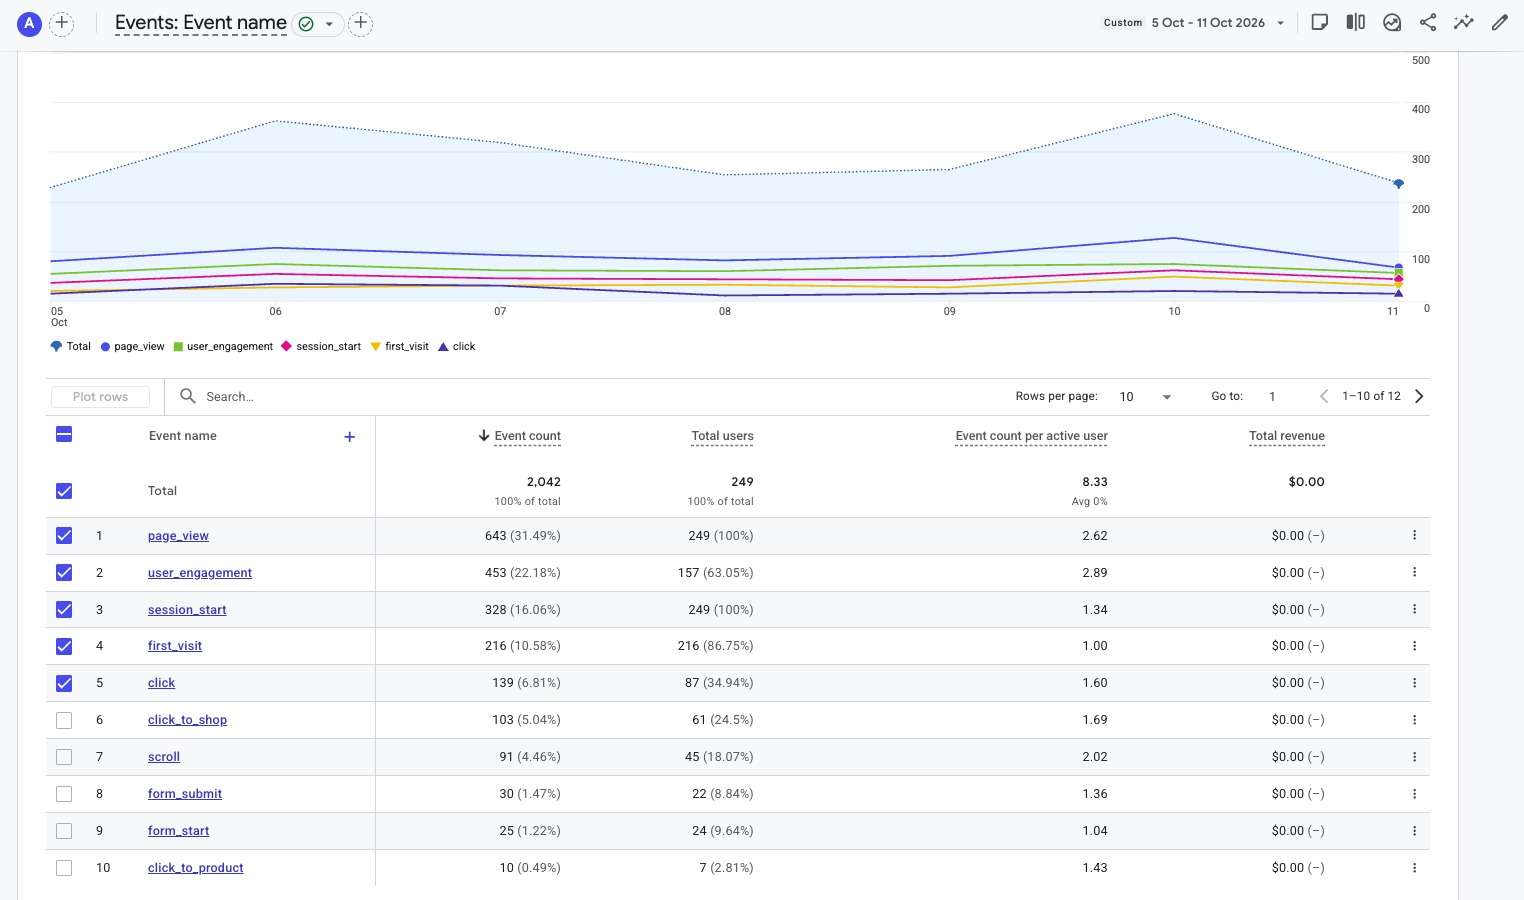
| Total events | 2,042 | Not shown | 8.33 events per active user |
| Click-to-Shop | 103 | ▼ 8.8% | 61 users |
| Click-to-Product | 10 | Not shown | 7 users |
| Key events | 1,870 | Not shown | Broad configuration; not sales |
Traffic Acquisition
| Channel | Sessions | Share | Engaged | Avg. time | WoW |
|---|---|---|---|---|---|
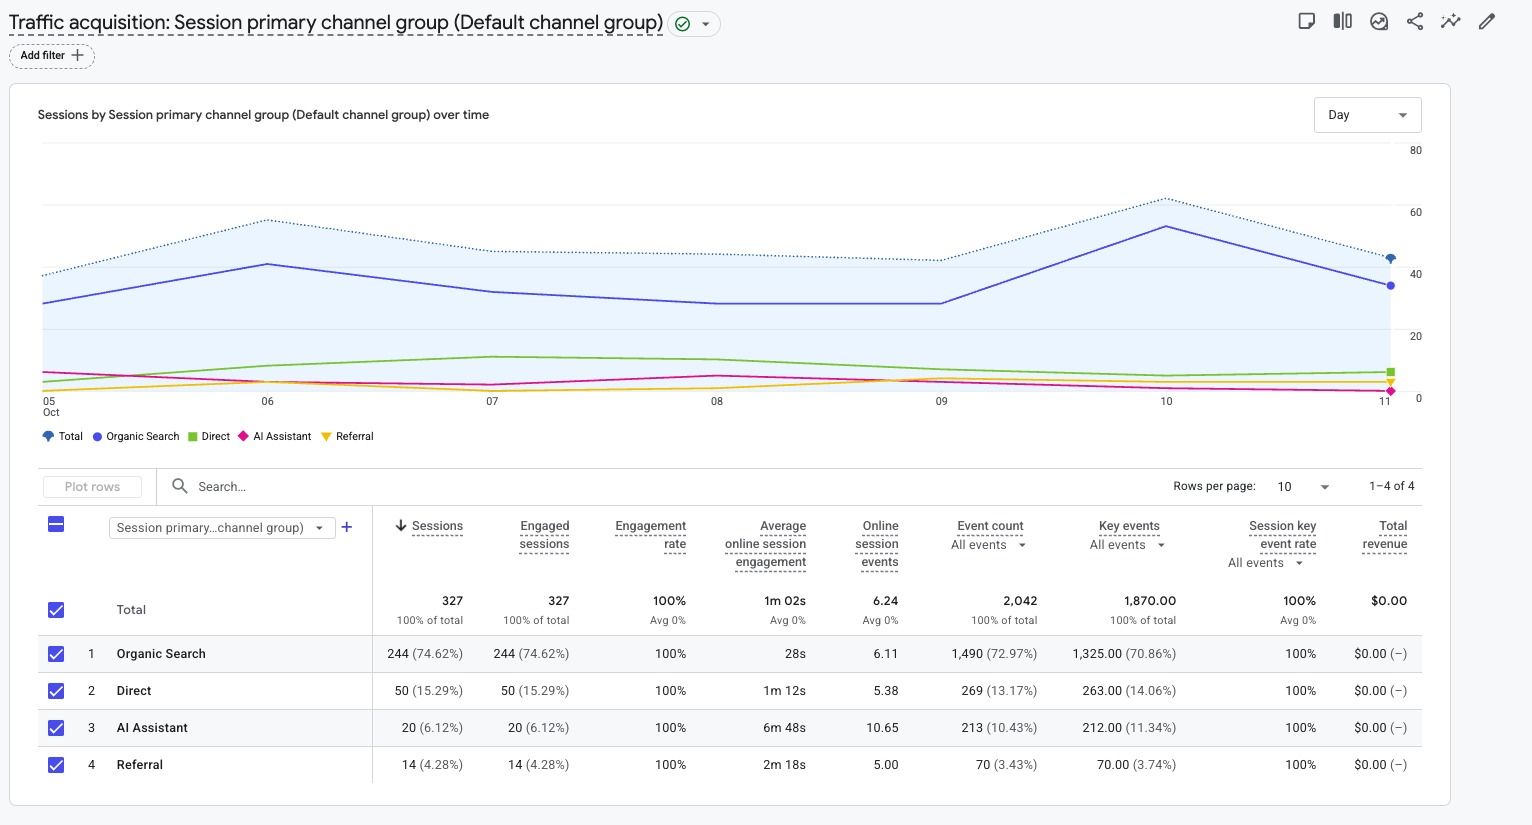
| Organic Search | 244 | 74.62% | 244 | 28s | ▼ 5.8% |
| Direct | 50 | 15.29% | 50 | 1m 12s | ▼ 65.0% |
| AI Assistant | 20 | 6.12% | 20 | 6m 48s | ▲ 66.7% |
| Referral | 14 | 4.28% | 14 | 2m 18s | 0.0% |
Store & Content Page Performance
| Page | Views | WoW |
|---|---|---|
| Harvey Avenue | 91 | ▲ 18.2% |
| ARC Liquor All Stores | 71 | ▼ 19.3% |
| Guisachan | 61 | ▼ 6.2% |
| Glenmore | 53 | ▲ 20.5% |
| Vernon Square Mall | 49 | ▲ 14.0% |
| Vernon 58th Avenue | 43 | ▼ 18.9% |
| Andrew Scott2 | 33 | Not shown |
| Revelstoke | 18 | ▼ 63.3% |
| Google Analytics - Sept28-Oct04 | 16 | Not shown |
| ARC's Monthly Discounted Offers - Vernon Square Mall | 11 | Not shown |
Store Visibility Analysis
Harvey, Glenmore and Vernon Square Mall improved. Revelstoke declined to 18 views. Andrew Scott2's 33 views came from one user and should be treated cautiously as potential development or testing activity.
AI Assistant Quality
20 sessions, 6m 48s average session engagement and 213 recorded events (10.65 per session). This is promising engagement, not a sales count.
Customer Intent
| Action | Count | Users |
|---|---|---|
| Click-to-Shop | 103 | 61 |
| Click-to-Product | 10 | 7 |
| Form submissions | 30 | 22 |
| Form starts | 25 | 24 |
| Total key events | 1870 | Not purchase total |
Shopping-path activity fell less sharply than overall traffic. Session key-event rate is 100%, but routine events qualify, so this is not a purchase conversion rate.
Recommended Actions
- Review why Direct traffic fell 65.0%.
- Protect Organic Search visibility.
- Monitor AI Assistant visitor journeys and downstream shopping actions.
- Review Revelstoke page reach and discoverability.
- Separate internal Andrew Scott2 testing from genuine customer usage.
- Reconcile the one-session channel discrepancy.
Trend Tracker
| Area | Status |
|---|---|
| Audience | Declining |
| Engagement | Improving |
| AI Assistant | Growing |
| Shopping actions | Softer |
| Tracking | Needs verification |
Supporting GA4 Evidence
Quote of the Week
Based on ARC's Week 30 GA4 results. Key events are not verified sales.