Enhanced Leadership Performance Report
Audience recovery, stronger shopping intent and measured interpretation.
ARC Digital Scorecard
Analytical leadership assessment, not a GA4 metric. Reach, discovery and shopping-path actions recovered; measurement caveats remain.
| Area | Status |
|---|---|
| Reach | Growing |
| Shopping intent | Recovering |
| Organic & Direct | Growing |
| Engagement | Review anomaly |
| Attribution | Reconcile rows |
Weekly Wins
- Sessions +12.7%; active users +16.4%; new users +16.1%.
- Click-to-Shop +22.7% to 92.
- Direct +27.2%; Organic +12.5%.
- Revelstoke, Glenmore, Vernon Square and gateway pages improved.
Watch List
- Prior-week engagement distortion from likely internal activity.
- AI Assistant: only three sessions.
- Channel rows do not reconcile to headline.
- Key events remain broadly configured.
Week 33: Audience and Shopping Intent Recover
Week 33 brought visitors and shopping-path activity back into growth, while last week's unusually high engagement measurement returned toward normal.
Performance Overview
| Metric | Week 33 | WoW | Reading |
|---|---|---|---|
| Sessions | 356 | ▲ 12.7% | Reach rebounded |
| Active users | 277 | ▲ 16.4% | Broader weekly audience |
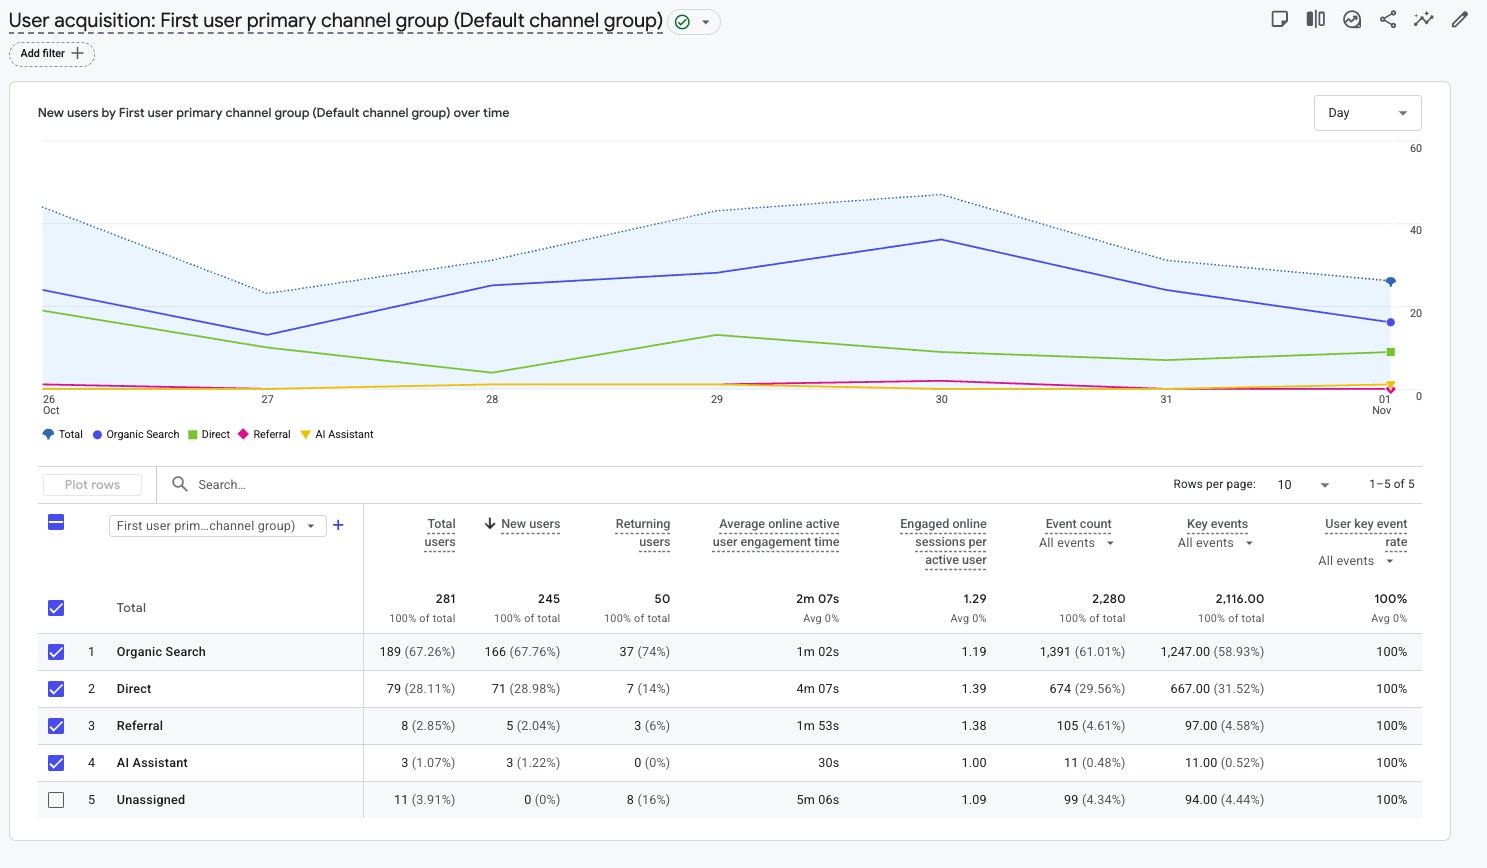
| New users | 245 | ▲ 16.1% | Discovery strengthened |
| Engaged sessions | 356 | ▲ 13.4% | 100% reported engagement rate; configuration-sensitive |
| Page views | 727 | ▲ 17.4% | 2.62 views / active user |
| Avg. engagement / active user | 2m 07s | ▼ 75.0% | Prior-week reading likely affected by internal testing |
| Total users | 281 | Not shown | User Acquisition total |
| Total events | 2,280 | ▲ 22.1% | All tracked event types |
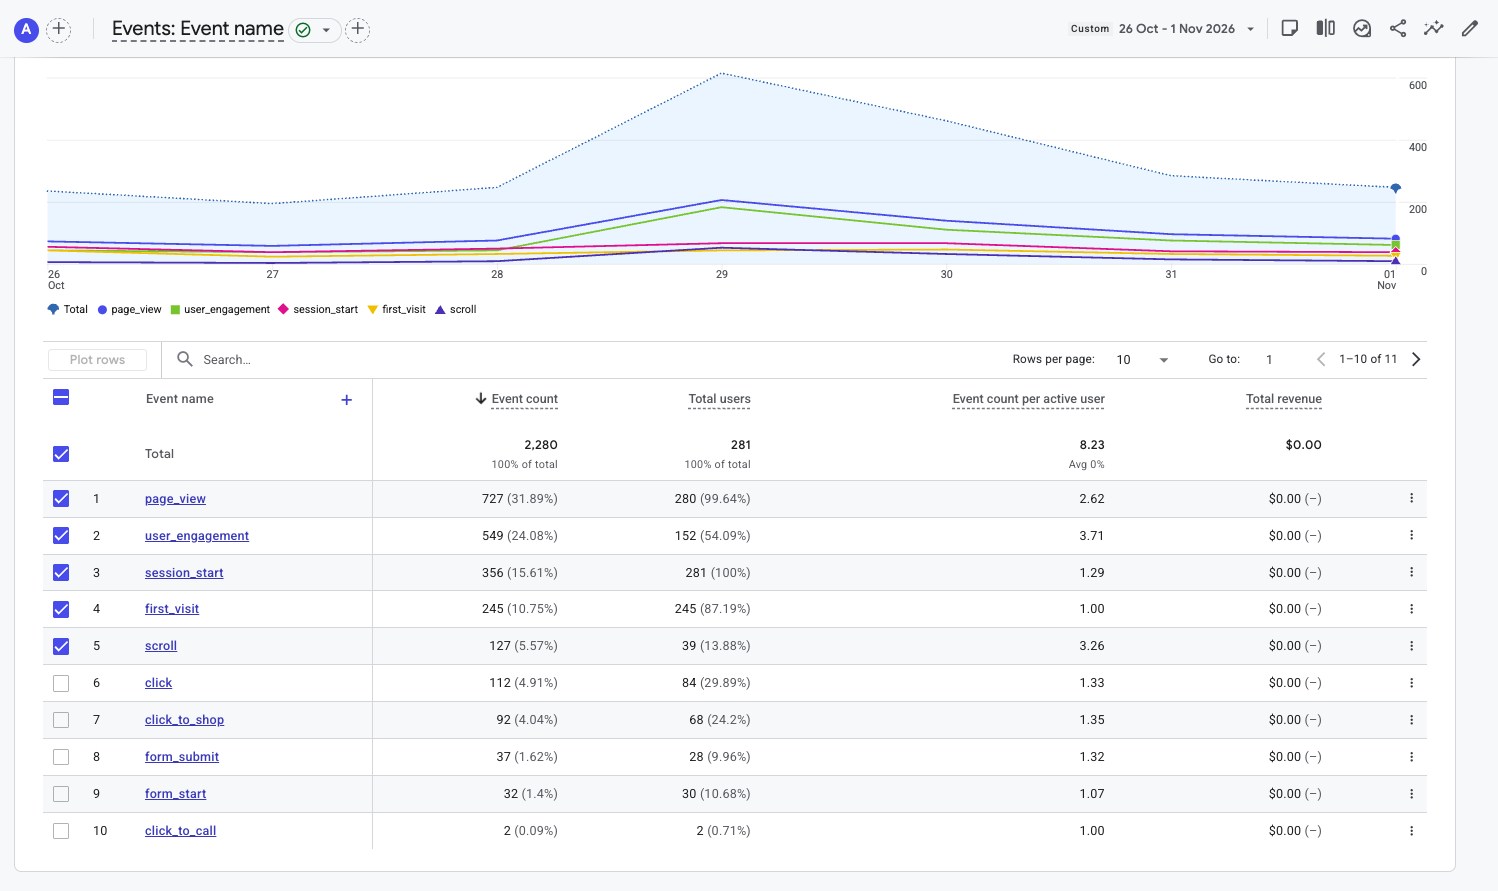
| Click-to-Shop | 92 | ▲ 22.7% | 68 users; shopping-path actions, not purchases |
| Click-to-Product | Not in top 10 | Not shown | Do not interpret as zero |
| Key events | 2,116 | Not shown | Broad key-event configuration; not sales |
Traffic Acquisition
| Channel | Sessions | Share | Engaged | Avg time | WoW |
|---|---|---|---|---|---|
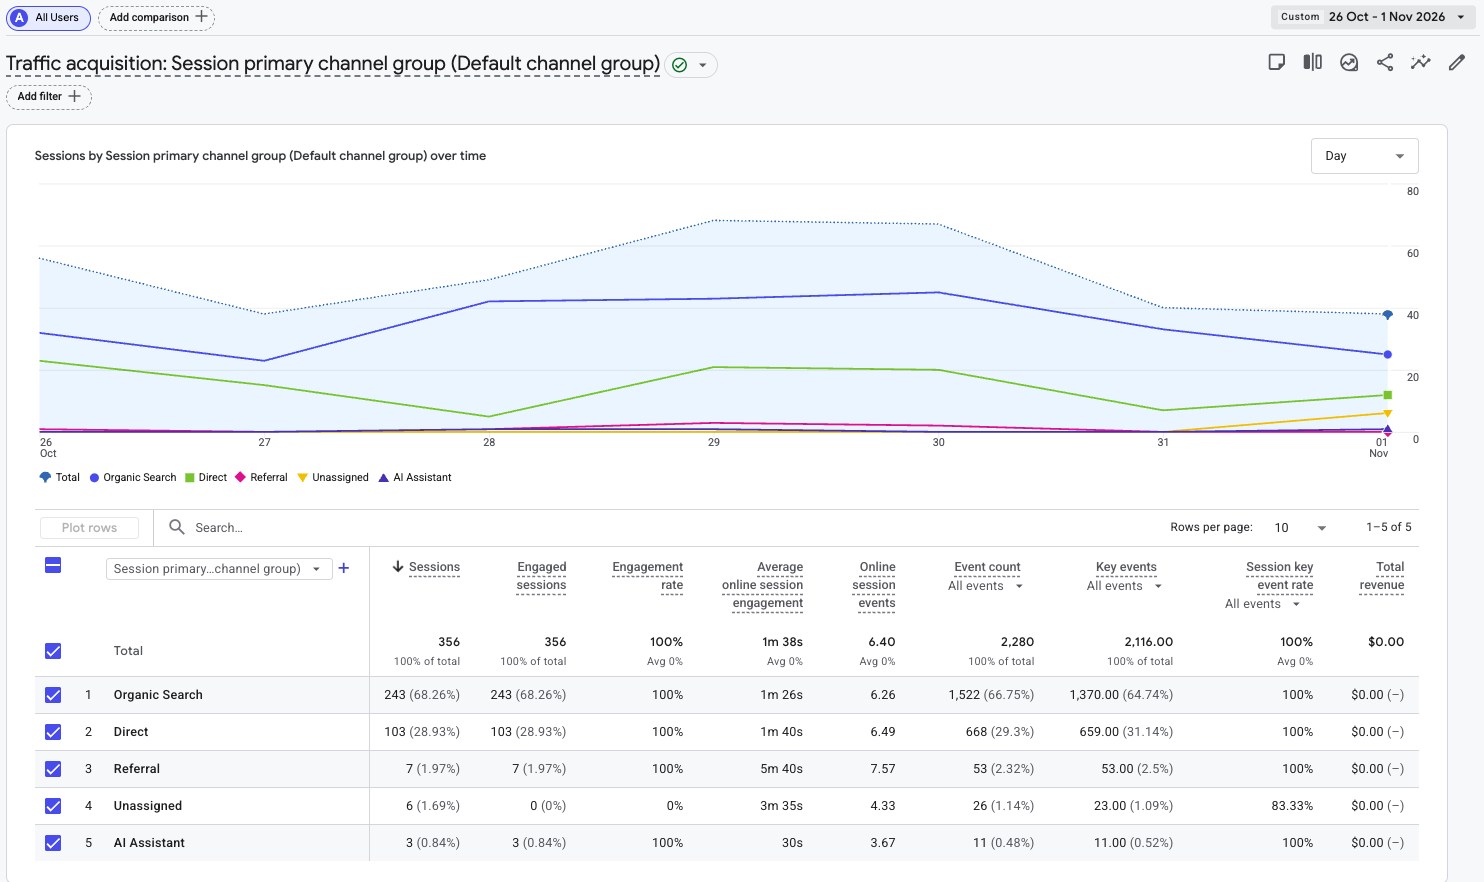
| Organic Search | 243 | 68.26% | 243 | 1m 26s | ▲ 12.5% |
| Direct | 103 | 28.93% | 103 | 1m 40s | ▲ 27.2% |
| Referral | 7 | 1.97% | 7 | 5m 40s | ▼ 46.2% |
| Unassigned | 6 | 1.69% | 0 | 3m 35s | ▲ 200.0% |
| AI Assistant | 3 | 0.84% | 3 | 30s | ▼ 25.0% |
Channel rows show 362 sessions against the reported 356 total; investigate before using percentages as reconciled shares.
Store & Content Performance
| Page | Views | WoW |
|---|---|---|
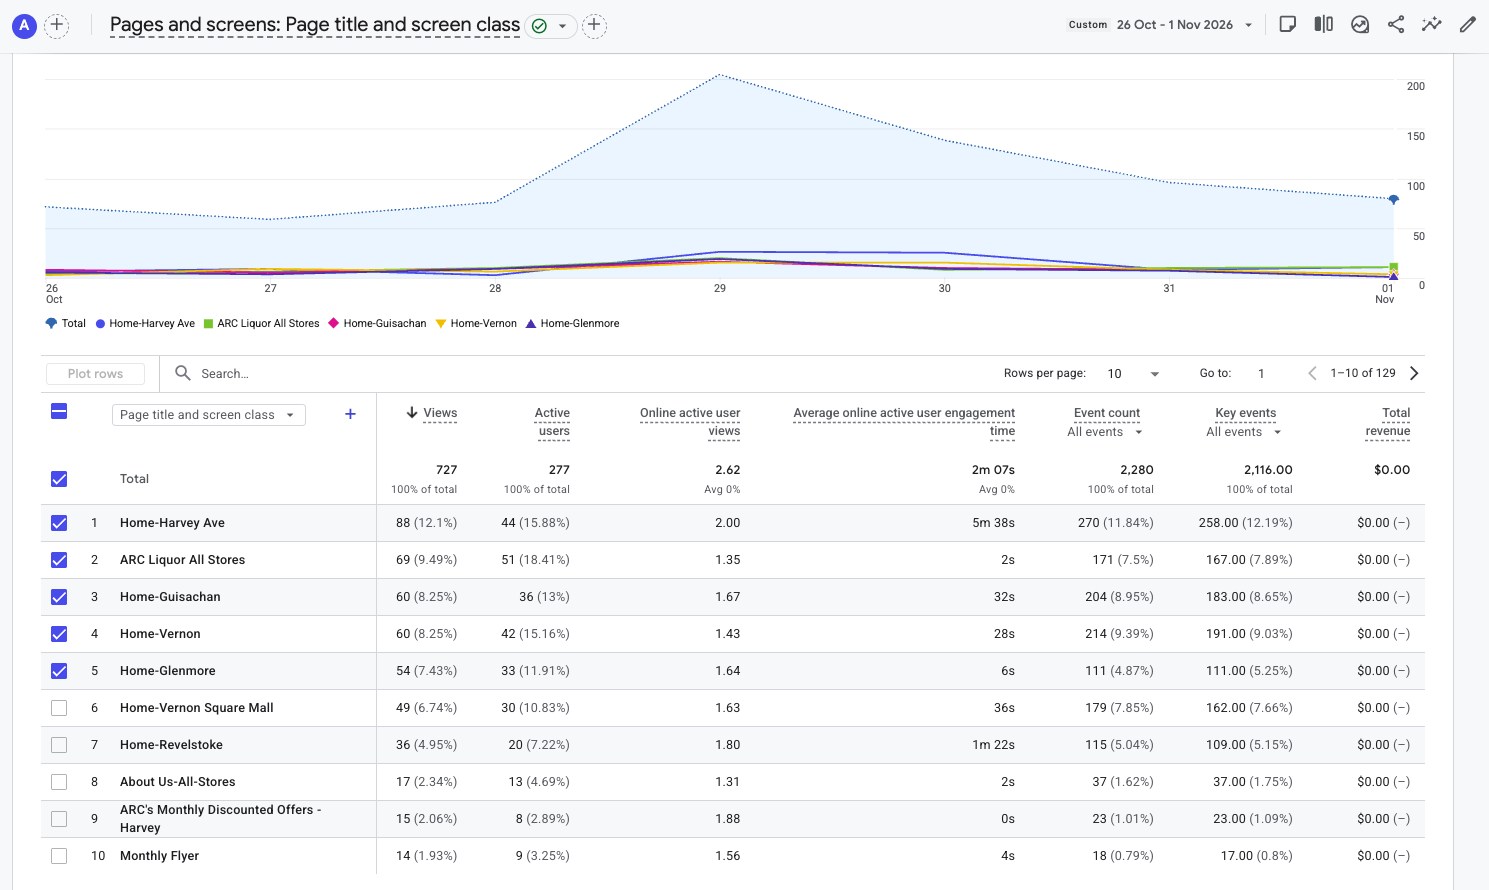
| Harvey Avenue | 88 | ▼ 19.3% |
| Vernon 58th Avenue | 60 | ▼ 14.3% |
| Guisachan | 60 | 0.0% |
| ARC Liquor All Stores | 69 | ▲ 35.3% |
| Glenmore | 54 | ▲ 28.6% |
| Vernon Square Mall | 49 | ▲ 14.0% |
| Revelstoke | 36 | ▲ 80.0% |
What This Means
The strongest store-level recoveries were Revelstoke (+80%), Glenmore (+28.6%), and All Stores (+35.3%). Harvey remains the leading store page. Internal development traffic may bias engagement-time reporting.
Customer Intent
| Measure | Week 33 | Interpretation |
|---|---|---|
| Click-to-Shop | 92 / 68 users | ▲ 22.7% |
| Click | 112 / 84 users | ▲ 6.7% |
| Scroll | 127 / 39 users | ▲ 115.3% |
| Form submissions | 37 / 28 users | Recorded events, not validated leads |
| Product clicks | Not shown | Do not assume zero |
AI Assistant Signal
AI Assistant recorded three sessions, down 25%, averaging 30 seconds per session. This is too small an audience for dependable conclusions about overall performance.
Recommended Actions
- Protect organic and direct acquisition gains.
- Monitor click-to-shop and confirmed downstream orders.
- Filter internal testing from GA4.
- Reconcile session channel totals.
- Validate forms and gateway navigation.
Trend Tracker
| Signal | Direction | Leadership read |
|---|---|---|
| Audience | Positive | Sessions +12.7%, users +16.4% |
| Organic | Positive | 243 sessions +12.5% |
| Direct | Positive | 103 sessions +27.2% |
| Shopping Intent | Positive | 92 clicks +22.7% |
| Engagement | Review | Prior week likely biased |
| Attribution | Review | 362 row sessions vs 356 total |
Supporting GA4 Reports