
Weekly Performance Report
Stable reach, softer engagement and distinct store-level gains.
Leadership takeaway
Week 31 traffic was only slightly lower: 317 sessions (▼3.1%), 239 active users (▼2.4%) and 212 new users (▼1.9%). Engagement quality was more concerning: average active-user engagement declined 37.4% to 52s, and Click-to-Shop fell 16.5% to 86 events across 59 users. Organic Search still supplied 75.71% of visits. Revelstoke, Vernon and Glenmore were positive store-page exceptions.
Weekly wins
- Traffic remained close to Week 30: 317 sessions (▼3.1%) and 239 active users (▼2.4%).
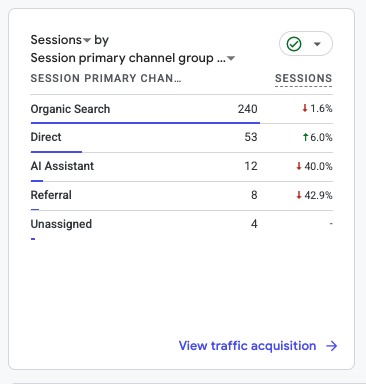
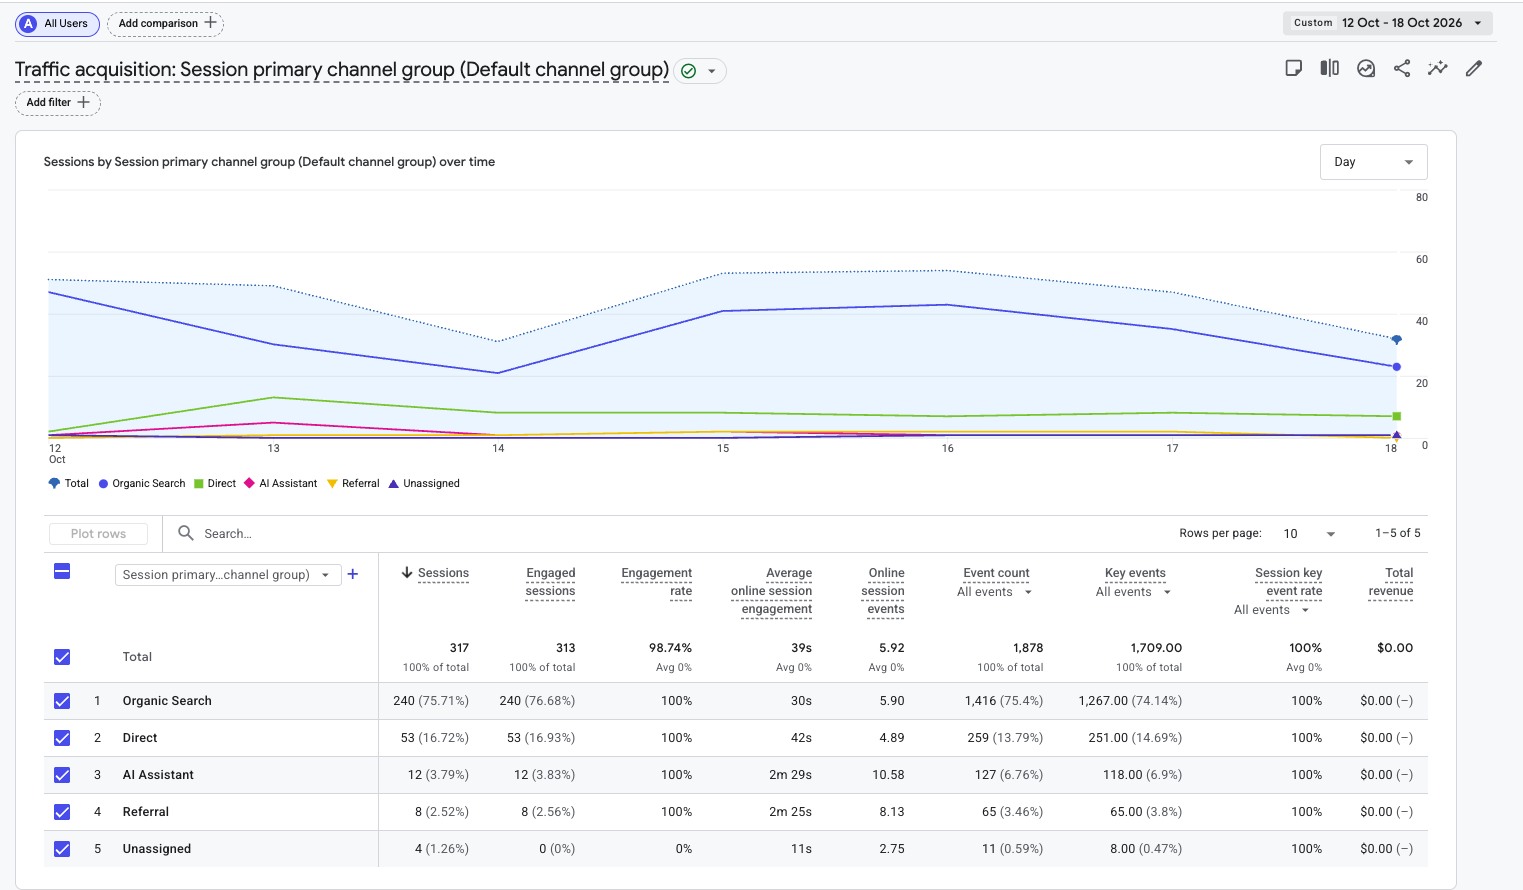
- Organic Search remained the dominant channel with 240 sessions (75.71%).
- Direct sessions increased to 53 (▲6.0%).
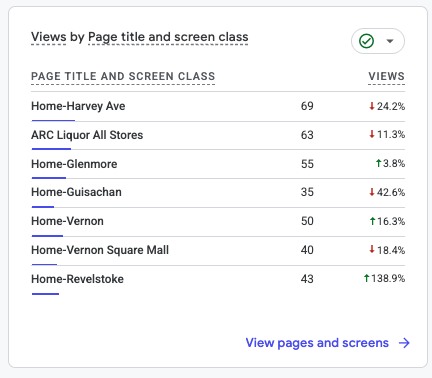
- Revelstoke page views climbed to 43 (▲138.9%); Vernon rose to 50 (▲16.3%), Glenmore to 55 (▲3.8%).
- Form submissions registered 38 events involving 25 users, compared with 30 events in Week 30.
Watch list
- Average engagement per active user fell to 52 seconds (▼37.4%).
- Click-to-Shop declined to 86 events (▼16.5%) involving 59 users.
- Guisachan page views fell 42.6%, Harvey 24.2% and Vernon Square Mall 18.4%.
- AI Assistant sessions fell from 20 to 12 (▼40.0%), while averaging 2m 29s per session.
- Broad key-event configuration still means the 100% session key-event rate is not a purchase conversion rate.
| Metric | Week 31 | WoW change | Reading |
|---|---|---|---|
| Sessions | 317 | ▼ 3.1% | Traffic softened slightly |
| Active users | 239 | ▼ 2.4% | Audience nearly stable |
| New users | 212 | ▼ 1.9% | New-user decline modest |
| Engaged sessions | 313 | ▼ 4.3% | 98.74% engagement rate |
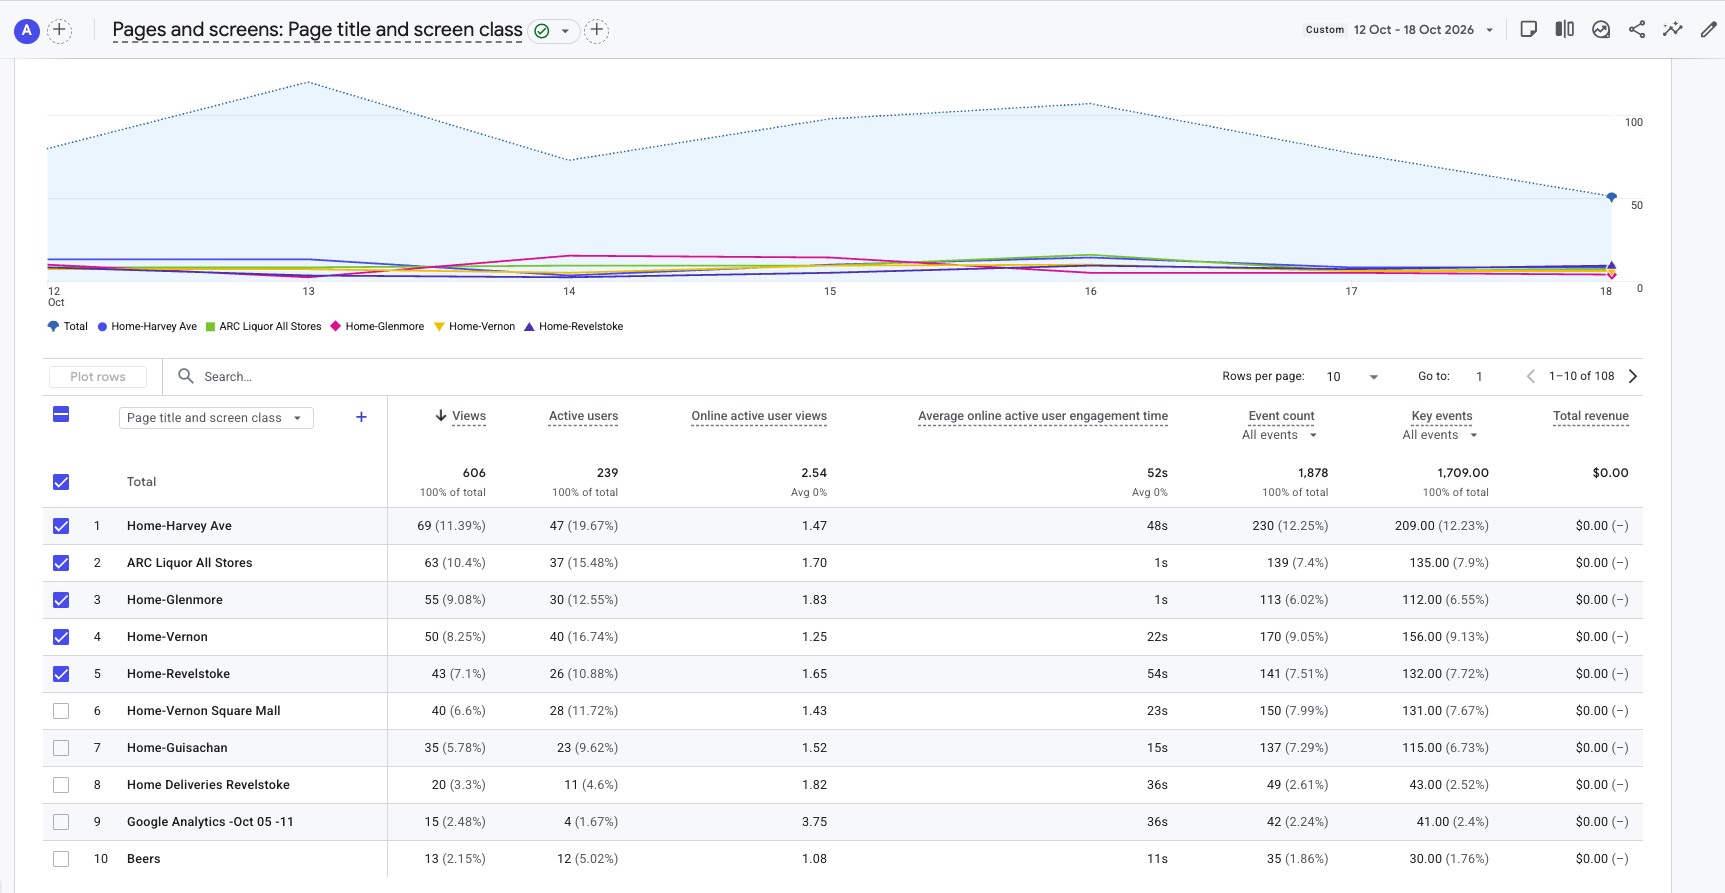
| Page views | 606 | ▼ 5.8% | 2.54 views per active user |
| Avg. engagement / active user | 52s | ▼ 37.4% | Per-session average 39s |
| Total users | 247 | Not shown | User Acquisition headline |
| Total events | 1,878 | ▼ 8.0% | All recorded GA4 events |
| Click-to-Shop | 86 | ▼ 16.5% | 59 users; shopping-path action |
| Click-to-Product | Not shown | Not shown | Outside first 10 visible events |
| Key events | 1,709 | Not shown | Broad configuration, not sales |
The six store homepages generated 292 views; together with the All Stores gateway (63), the seven pages recorded 355 views, or 58.6% of 606 views. Views are additive; page-level active-user counts are not.
| Page | Views | Active users | Avg. engagement | Views WoW |
|---|---|---|---|---|
| Harvey Avenue | 69 | 47 | 48s | ▼ 24.2% |
| ARC Liquor All Stores | 63 | 37 | 1s | ▼ 11.3% |
| Glenmore | 55 | 30 | 1s | ▲ 3.8% |
| Vernon 58th Avenue | 50 | 40 | 22s | ▲ 16.3% |
| Revelstoke | 43 | 26 | 54s | ▲ 138.9% |
| Vernon Square Mall | 40 | 28 | 23s | ▼ 18.4% |
| Guisachan | 35 | 23 | 15s | ▼ 42.6% |
| Home Deliveries Revelstoke | 20 | 11 | 36s | Not shown |
| Google Analytics - Oct 05-11 | 15 | 4 | 36s | Not shown |
| Beers | 13 | 12 | 11s | Not shown |
| Channel | Sessions | GA4 share | Engaged | Avg. session engagement | Sessions WoW |
|---|---|---|---|---|---|
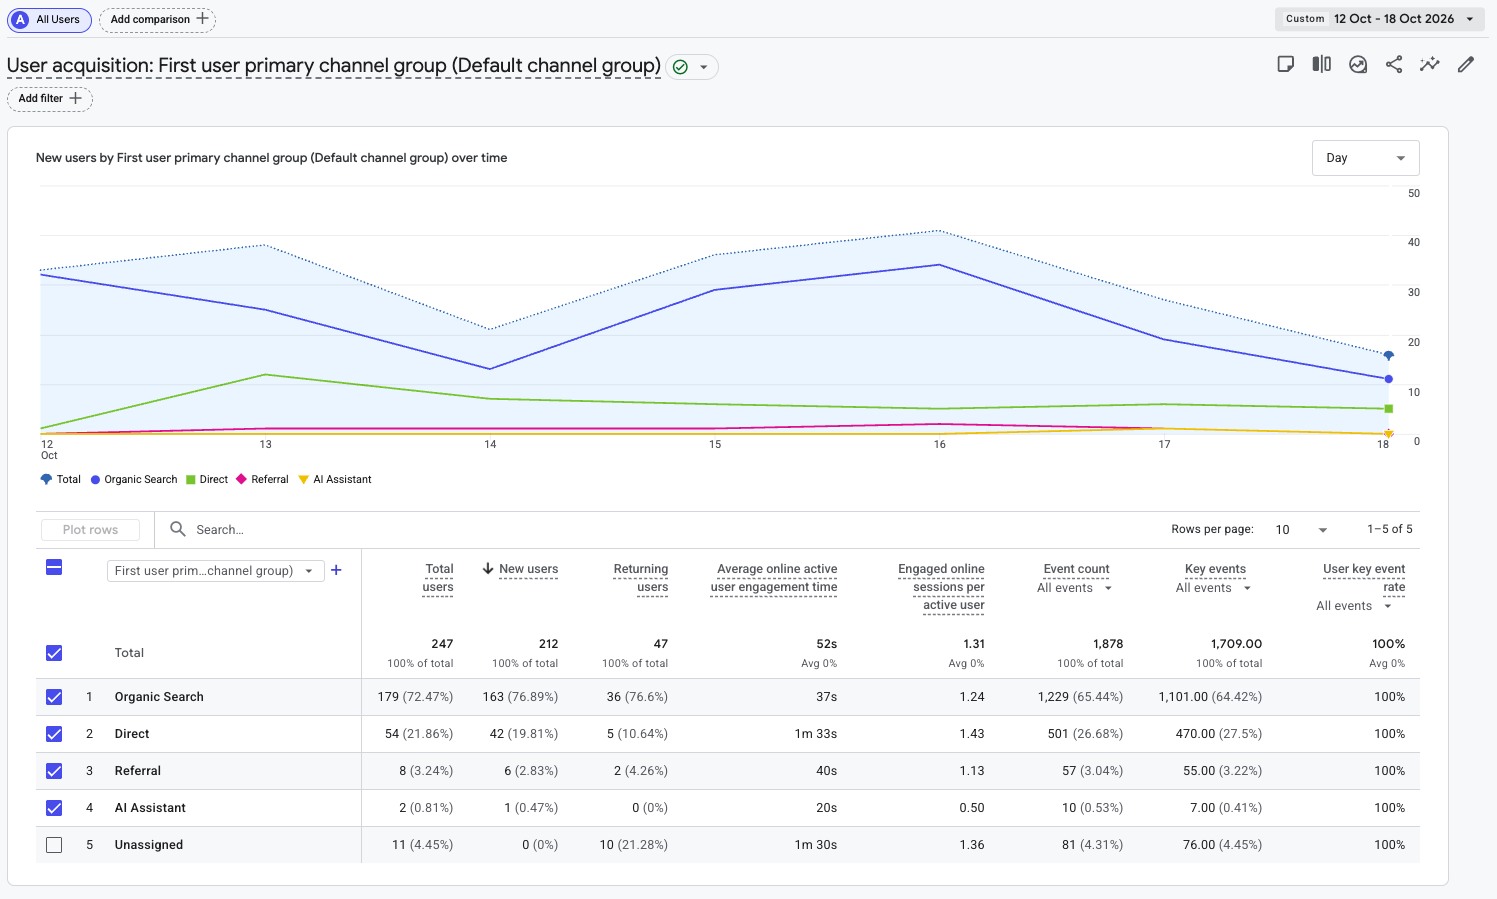
| Organic Search | 240 | 75.71% | 240 | 30s | ▼ 1.6% |
| Direct | 53 | 16.72% | 53 | 42s | ▲ 6.0% |
| AI Assistant | 12 | 3.79% | 12 | 2m 29s | ▼ 40.0% |
| Referral | 8 | 2.52% | 8 | 2m 25s | ▼ 42.9% |
| Unassigned | 4 | 1.26% | 0 | 11s | Not shown |
First-time discovery
GA4 User Acquisition recorded 212 new users: 163 from Organic Search, 42 Direct, 6 Referral and 1 AI Assistant. Total users were 247; returning users were 47. First-user and session-based attribution have different scopes.
| Event | Count | Total users | Count WoW |
|---|---|---|---|
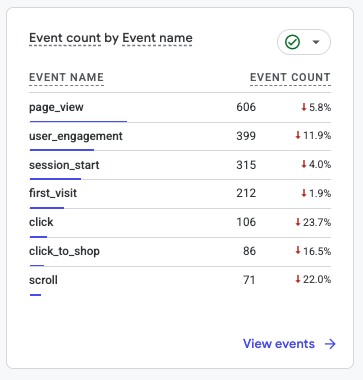
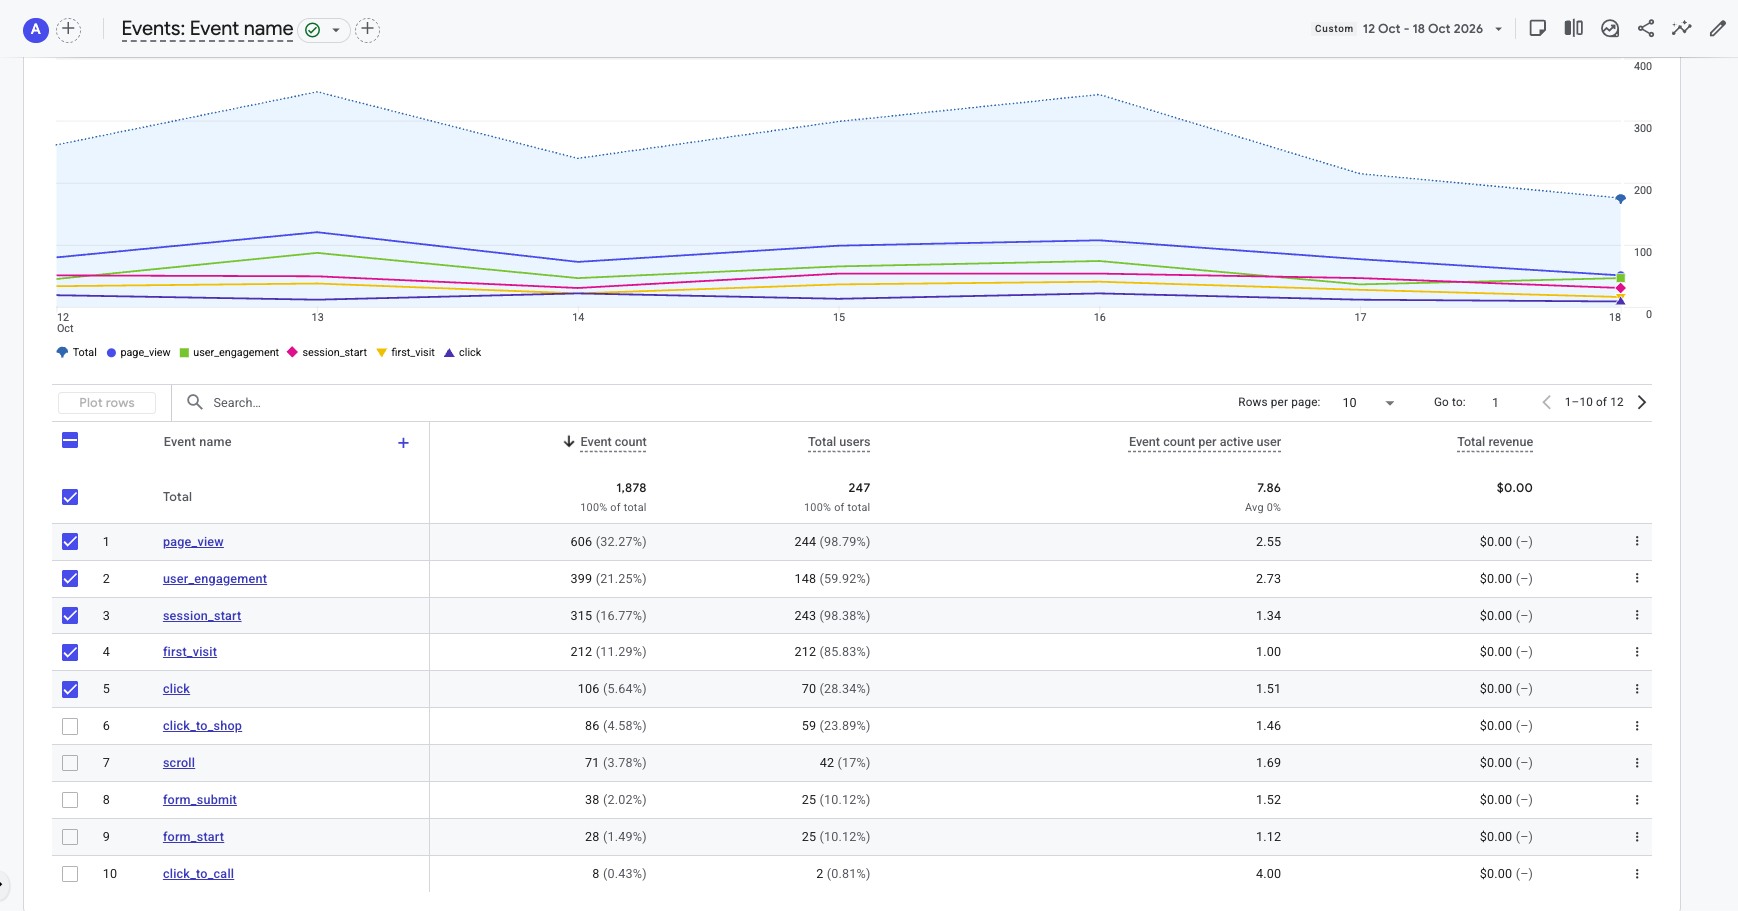
| page_view | 606 | 244 | ▼ 5.8% |
| user_engagement | 399 | 148 | ▼ 11.9% |
| session_start | 315 | 243 | ▼ 4.0% |
| first_visit | 212 | 212 | ▼ 1.9% |
| click | 106 | 70 | ▼ 23.7% |
| click_to_shop | 86 | 59 | ▼ 16.5% |
| scroll | 71 | 42 | ▼ 22.0% |
| form_submit | 38 | 25 | Not shown |
| form_start | 28 | 25 | Not shown |
| click_to_call | 8 | 2 | Not shown |
| Measure | Week 31 | Meaning |
|---|---|---|
| Click-to-Shop | 86 events / 59 users | ▼16.5%; action toward shopping |
| Click-to-Call | 8 events / 2 users | Phone-intent action; completion unverified |
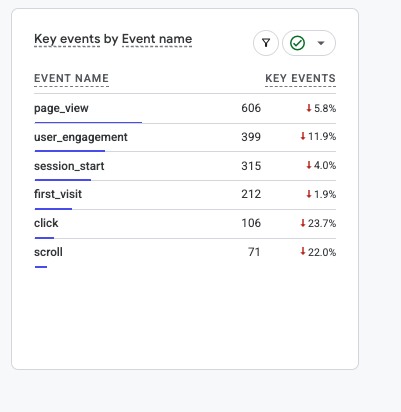
| Key events | 1,709 | Includes routine events; not sales |
| Session key-event rate | 100% | Configuration-dependent, not a purchase rate |
| GA4 revenue | $0 | Does not establish external or in-store sales |
- Review changes to Click-to-Shop and placement of store shopping calls-to-action.
- Examine source/landing-page and content patterns behind reduced engagement time.
- Study Revelstoke and Vernon page increases; distinguish new customer interest from changes in navigation or testing.
- Review Guisachan, Harvey and Vernon Square Mall search visibility and page performance.
- Track AI Assistant sessions alongside duration and meaningful shopping actions; do not infer outcomes from session totals.
- Validate form events: 38 submits versus 28 starts do not support a reliable completion rate.
- Review key-event setup to distinguish ordinary website activity from commercial intent.
Week 31 was closer to stable than the headline engagement declines suggest: sessions were down 3.1% while Organic Search continued to contribute most traffic. However, the drop in Click-to-Shop and average engagement warrants attention. Revelstoke, Vernon and Glenmore offered clear store-level positives.
“Week 31 held close to last week in visitor numbers, while Revelstoke, Vernon and Glenmore gained visibility; the priority now is restoring engagement and shopping intent.”
Source & comparison notes
ARC GA4 screenshots, October 12–18, 2026; compared with October 5–11. Exact table figures take precedence over rounded snapshot cards. Sessions (317) and session_start events (315) are different metrics. Routine events are included among key events. No online purchase or revenue conversion is established here.