Enhanced Leadership Performance Report
A leadership-focused interpretation of traffic, engagement, store visibility and shopping intent.
ARC Digital Scorecard
Reach held relatively close to Week 30, but shopping activity and measured engagement weakened. The scorecard presents qualitative analysis, not a GA4-issued score.
| Area | Direction | Reading |
|---|---|---|
| Reach | Near stable | 317 sessions (▼3.1%) |
| Organic Search | Dominant | 240 sessions; 75.71% share |
| Shopping intent | Watch | 86 Click-to-Shop events (▼16.5%) |
| Store pages | Mixed | Revelstoke +138.9%; Guisachan -42.6% |
| Engagement | Watch | 52s per active user (▼37.4%) |
| Measurement | Review | Routine activity counted among key events |
Weekly Wins
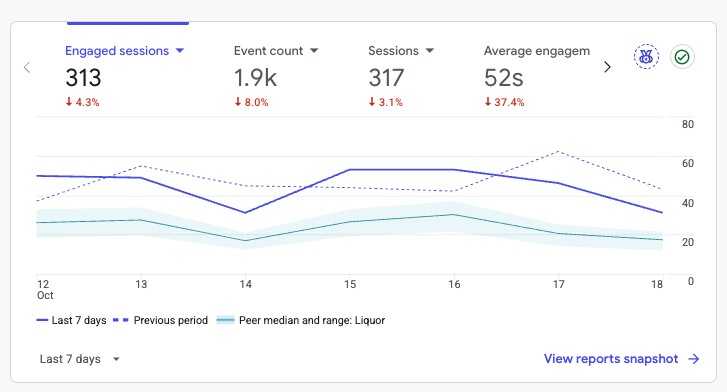
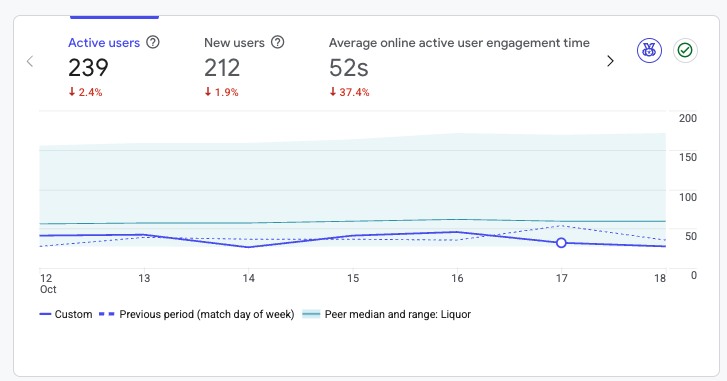
- Traffic remained close to Week 30: 317 sessions (▼3.1%) and 239 active users (▼2.4%).
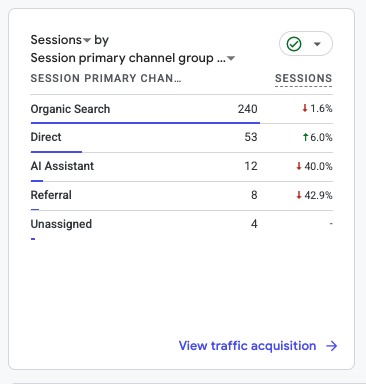
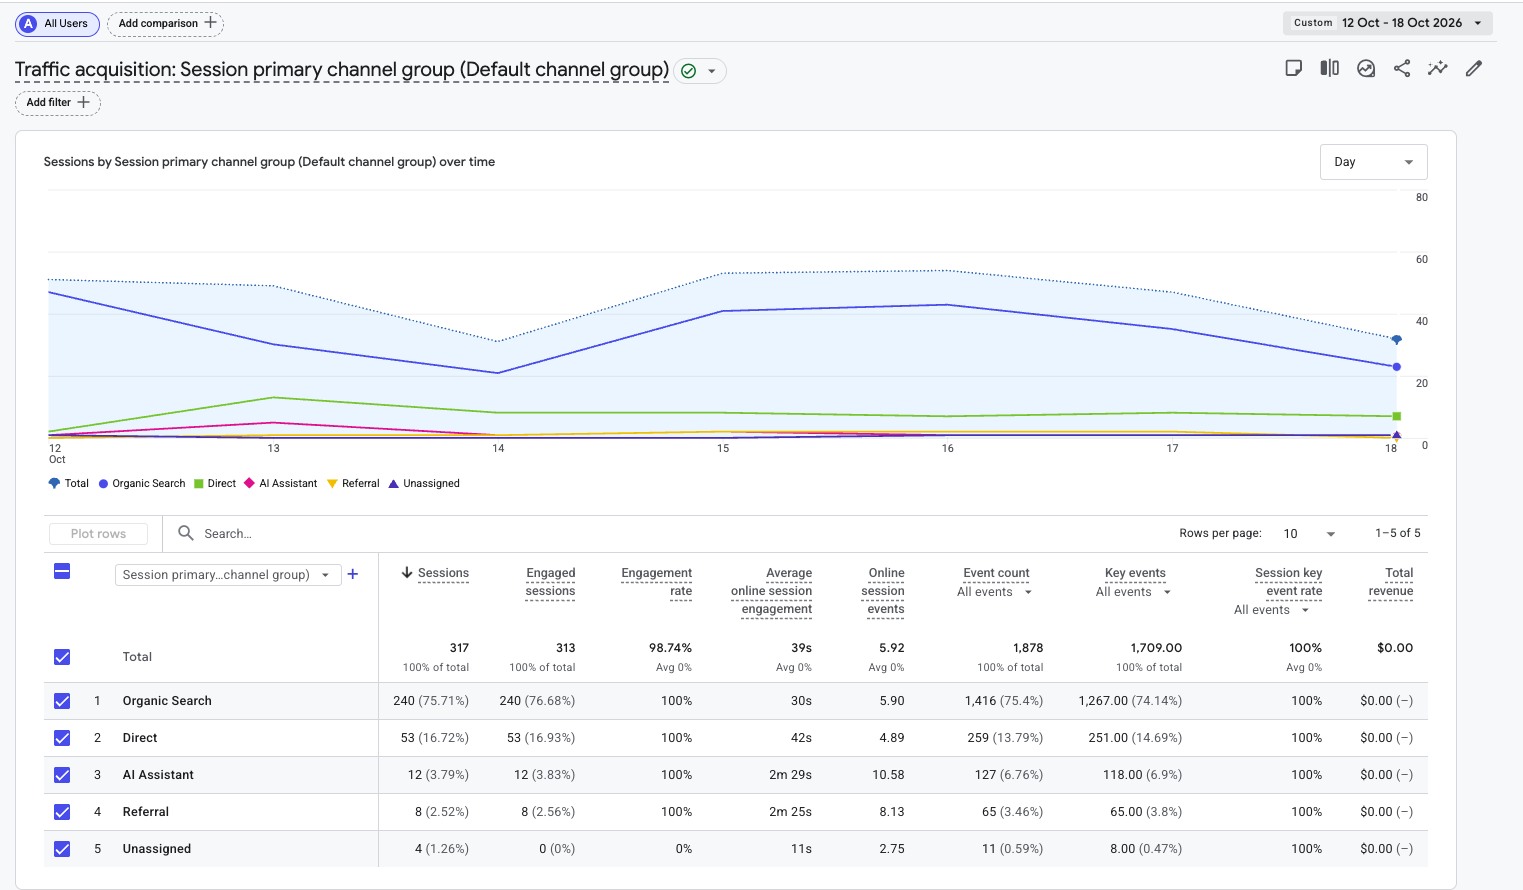
- Organic Search remained the dominant channel with 240 sessions (75.71%).
- Direct sessions increased to 53 (▲6.0%).
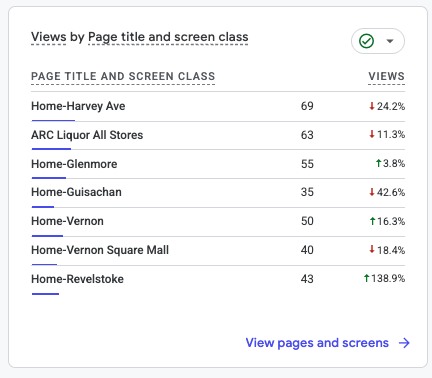
- Revelstoke page views climbed to 43 (▲138.9%); Vernon rose to 50 (▲16.3%), Glenmore to 55 (▲3.8%).
- Form submissions registered 38 events involving 25 users, compared with 30 events in Week 30.
Watch List
- Average engagement per active user fell to 52 seconds (▼37.4%).
- Click-to-Shop declined to 86 events (▼16.5%) involving 59 users.
- Guisachan page views fell 42.6%, Harvey 24.2% and Vernon Square Mall 18.4%.
- AI Assistant sessions fell from 20 to 12 (▼40.0%), while averaging 2m 29s per session.
- Broad key-event configuration still means the 100% session key-event rate is not a purchase conversion rate.
Week 31: Traffic Steadies, Intent Needs Attention
Week 31 traffic was only slightly lower: 317 sessions (▼3.1%), 239 active users (▼2.4%) and 212 new users (▼1.9%). Engagement quality was more concerning: average active-user engagement declined 37.4% to 52s, and Click-to-Shop fell 16.5% to 86 events across 59 users. Organic Search still supplied 75.71% of visits. Revelstoke, Vernon and Glenmore were positive store-page exceptions.
Performance Overview
| Metric | Week 31 | WoW | Leadership read |
|---|---|---|---|
| Sessions | 317 | ▼ 3.1% | Traffic softened slightly |
| Active users | 239 | ▼ 2.4% | Audience nearly stable |
| New users | 212 | ▼ 1.9% | New-user decline modest |
| Engaged sessions | 313 | ▼ 4.3% | 98.74% engagement rate |
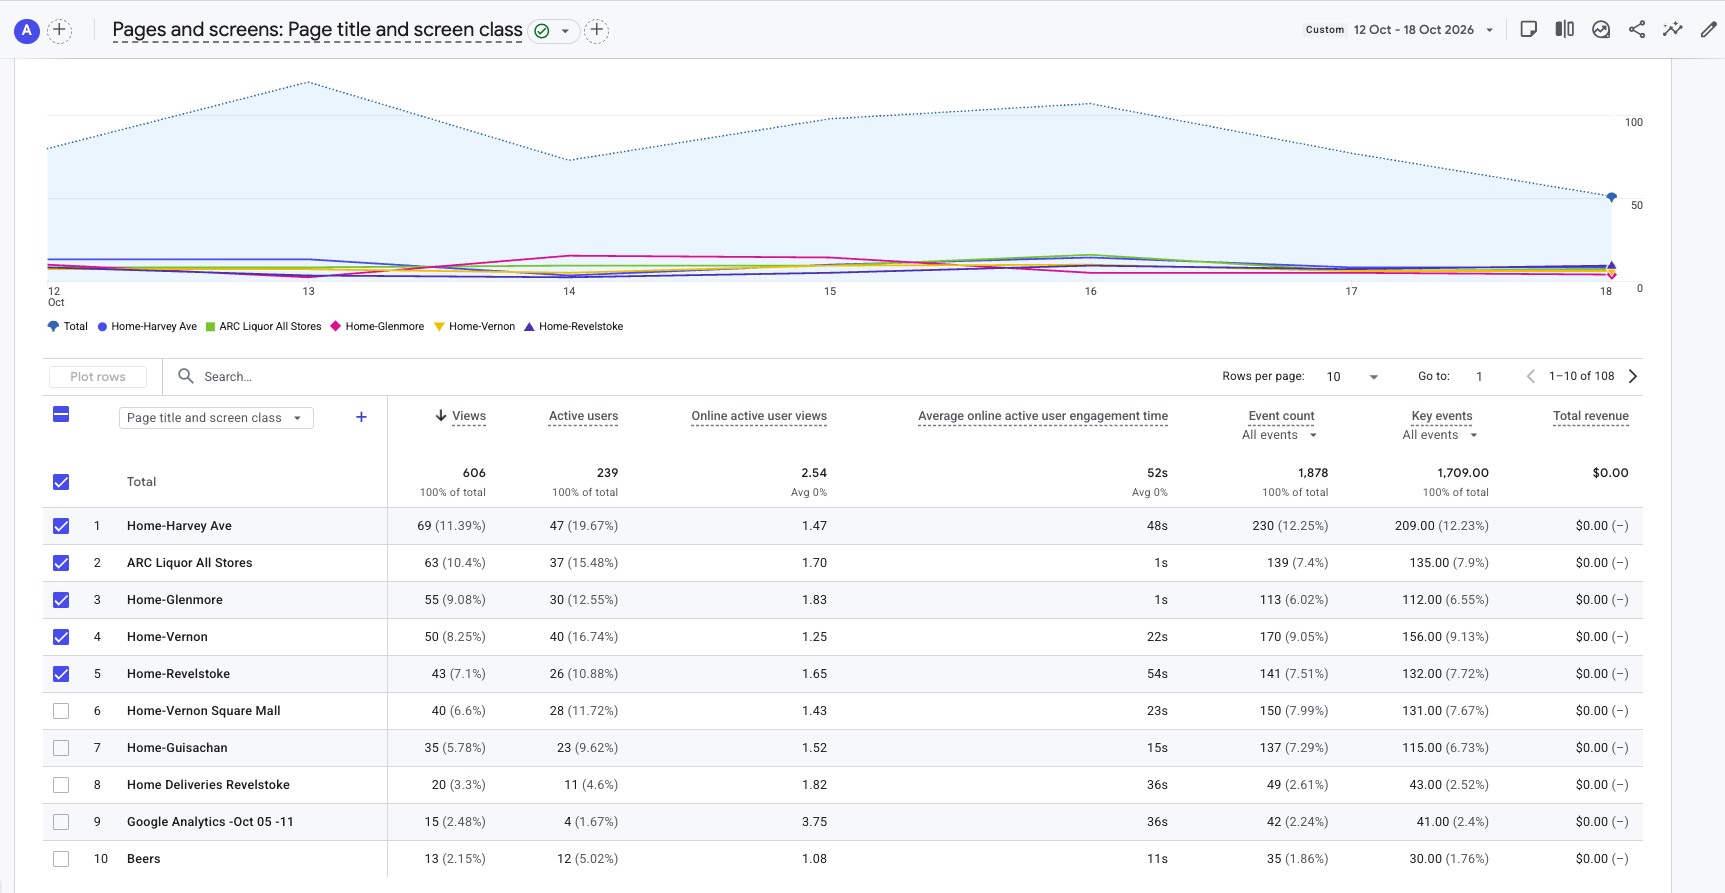
| Page views | 606 | ▼ 5.8% | 2.54 views per active user |
| Avg. engagement / active user | 52s | ▼ 37.4% | Per-session average 39s |
| Total users | 247 | Not shown | User Acquisition headline |
| Total events | 1,878 | ▼ 8.0% | All recorded GA4 events |
| Click-to-Shop | 86 | ▼ 16.5% | 59 users; shopping-path action |
| Click-to-Product | Not shown | Not shown | Outside first 10 visible events |
| Key events | 1,709 | Not shown | Broad configuration, not sales |
Traffic Acquisition
| Channel | Sessions | Share | Engaged | Avg. time | WoW |
|---|---|---|---|---|---|
| Organic Search | 240 | 75.71% | 240 | 30s | ▼ 1.6% |
| Direct | 53 | 16.72% | 53 | 42s | ▲ 6.0% |
| AI Assistant | 12 | 3.79% | 12 | 2m 29s | ▼ 40.0% |
| Referral | 8 | 2.52% | 8 | 2m 25s | ▼ 42.9% |
| Unassigned | 4 | 1.26% | 0 | 11s | Not shown |
Store & Content Performance
| Page | Views | WoW |
|---|---|---|
| Harvey Avenue | 69 | ▼ 24.2% |
| ARC Liquor All Stores | 63 | ▼ 11.3% |
| Glenmore | 55 | ▲ 3.8% |
| Vernon 58th Avenue | 50 | ▲ 16.3% |
| Revelstoke | 43 | ▲ 138.9% |
| Vernon Square Mall | 40 | ▼ 18.4% |
| Guisachan | 35 | ▼ 42.6% |
| Home Deliveries Revelstoke | 20 | Not shown |
| Google Analytics - Oct 05-11 | 15 | Not shown |
| Beers | 13 | Not shown |
What This Means
Revelstoke grew from 18 to 43 views (+138.9%), while Vernon gained to 50 (+16.3%). Glenmore reached 55 (+3.8%). Harvey, Guisachan and Vernon Square Mall declined; page engagement metrics should be reviewed alongside sources and page objectives.
The seven store/gateway pages accounted for 355 of the site's 606 views.
Customer Intent
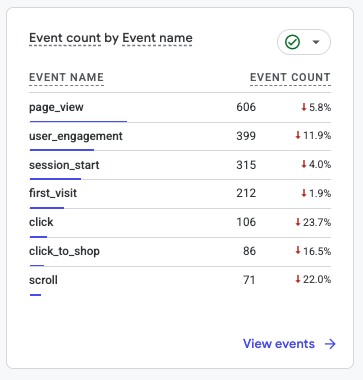
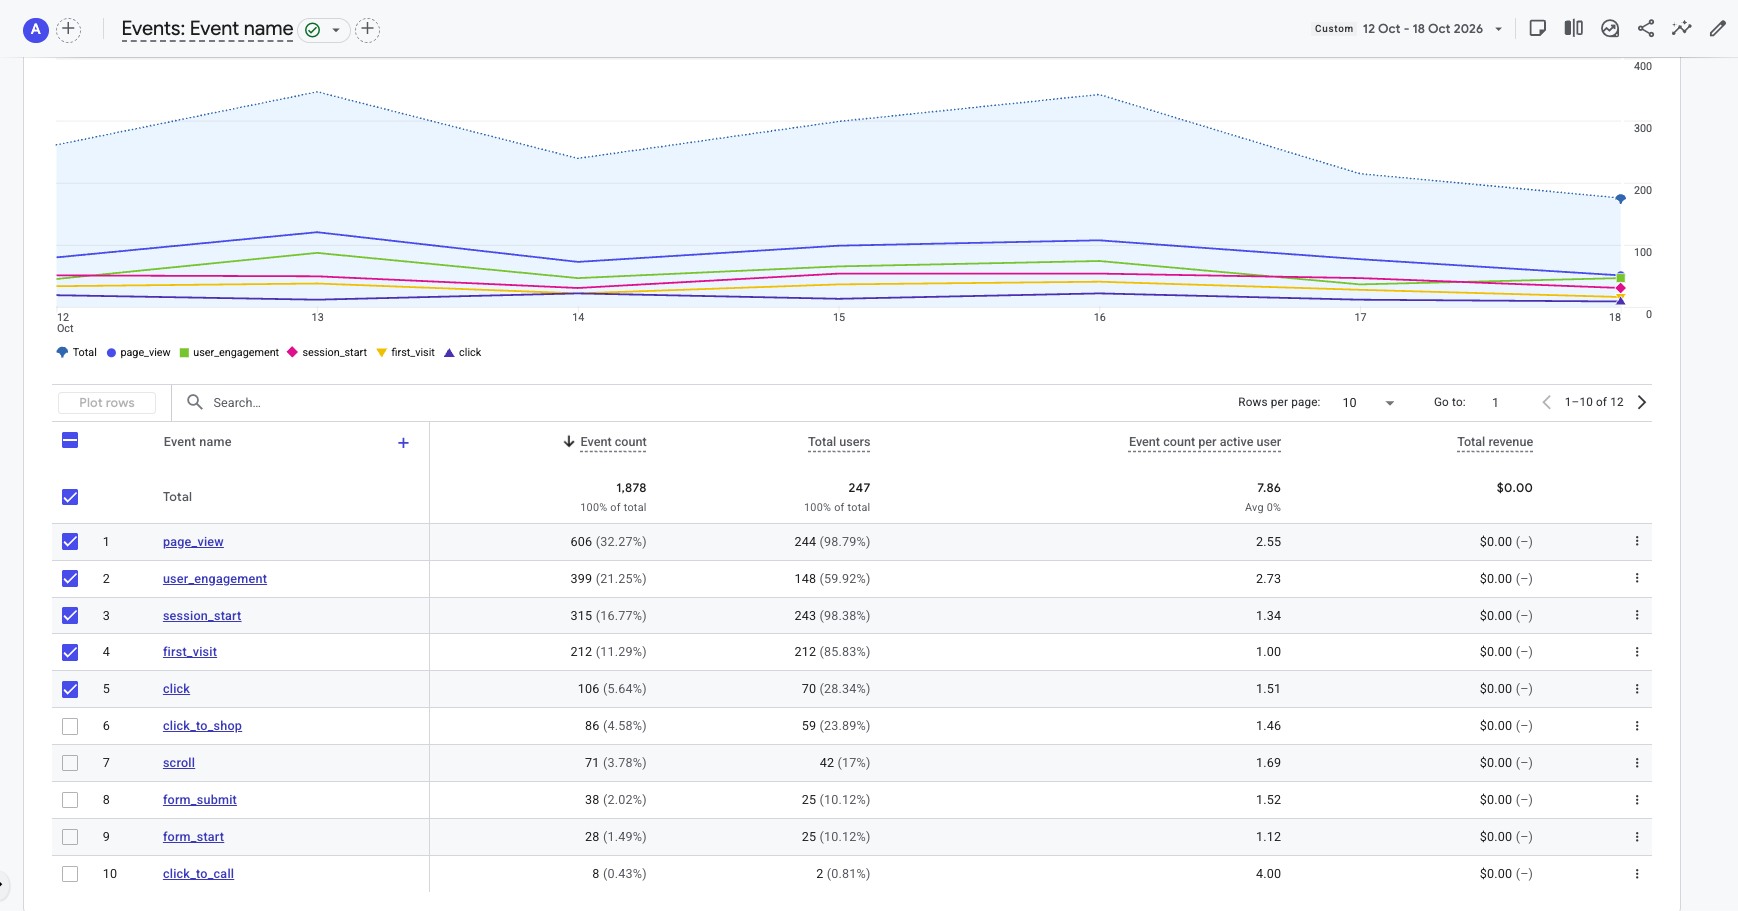
| Event | Count | Users | Comparison |
|---|---|---|---|
| page_view | 606 | 244 | ▼ 5.8% |
| user_engagement | 399 | 148 | ▼ 11.9% |
| session_start | 315 | 243 | ▼ 4.0% |
| first_visit | 212 | 212 | ▼ 1.9% |
| click | 106 | 70 | ▼ 23.7% |
| click_to_shop | 86 | 59 | ▼ 16.5% |
| scroll | 71 | 42 | ▼ 22.0% |
| form_submit | 38 | 25 | Not shown |
| form_start | 28 | 25 | Not shown |
| click_to_call | 8 | 2 | Not shown |
AI Assistant Signal
AI Assistant generated 12 sessions (▼40.0%), averaging 2m 29s of session engagement and 10.58 events per session. Deep use remains visible in the small cohort, but Week 31 volume is lower.
Recommended Actions
- Review changes to Click-to-Shop and placement of store shopping calls-to-action.
- Examine source/landing-page and content patterns behind reduced engagement time.
- Study Revelstoke and Vernon page increases; distinguish new customer interest from changes in navigation or testing.
- Review Guisachan, Harvey and Vernon Square Mall search visibility and page performance.
- Track AI Assistant sessions alongside duration and meaningful shopping actions; do not infer outcomes from session totals.
- Validate form events: 38 submits versus 28 starts do not support a reliable completion rate.
- Review key-event setup to distinguish ordinary website activity from commercial intent.
Trend Tracker
| Signal | Direction | Interpretation |
|---|---|---|
| Total traffic | Softer | 317 sessions, down 3.1% |
| Organic Search | Stable-ish | 240, down 1.6% |
| Direct | Improved | 53, up 6.0% |
| Shopping intent | Watch | 86 actions, down 16.5% |
| Revelstoke | Improved | 43 views, up 138.9% |
| Engagement | Watch | 52s per active user, down 37.4% |
Supporting GA4 Reports