
Weekly Performance Report
Organic Search and shopping clicks rose as overall reach softened.
Leadership takeaway
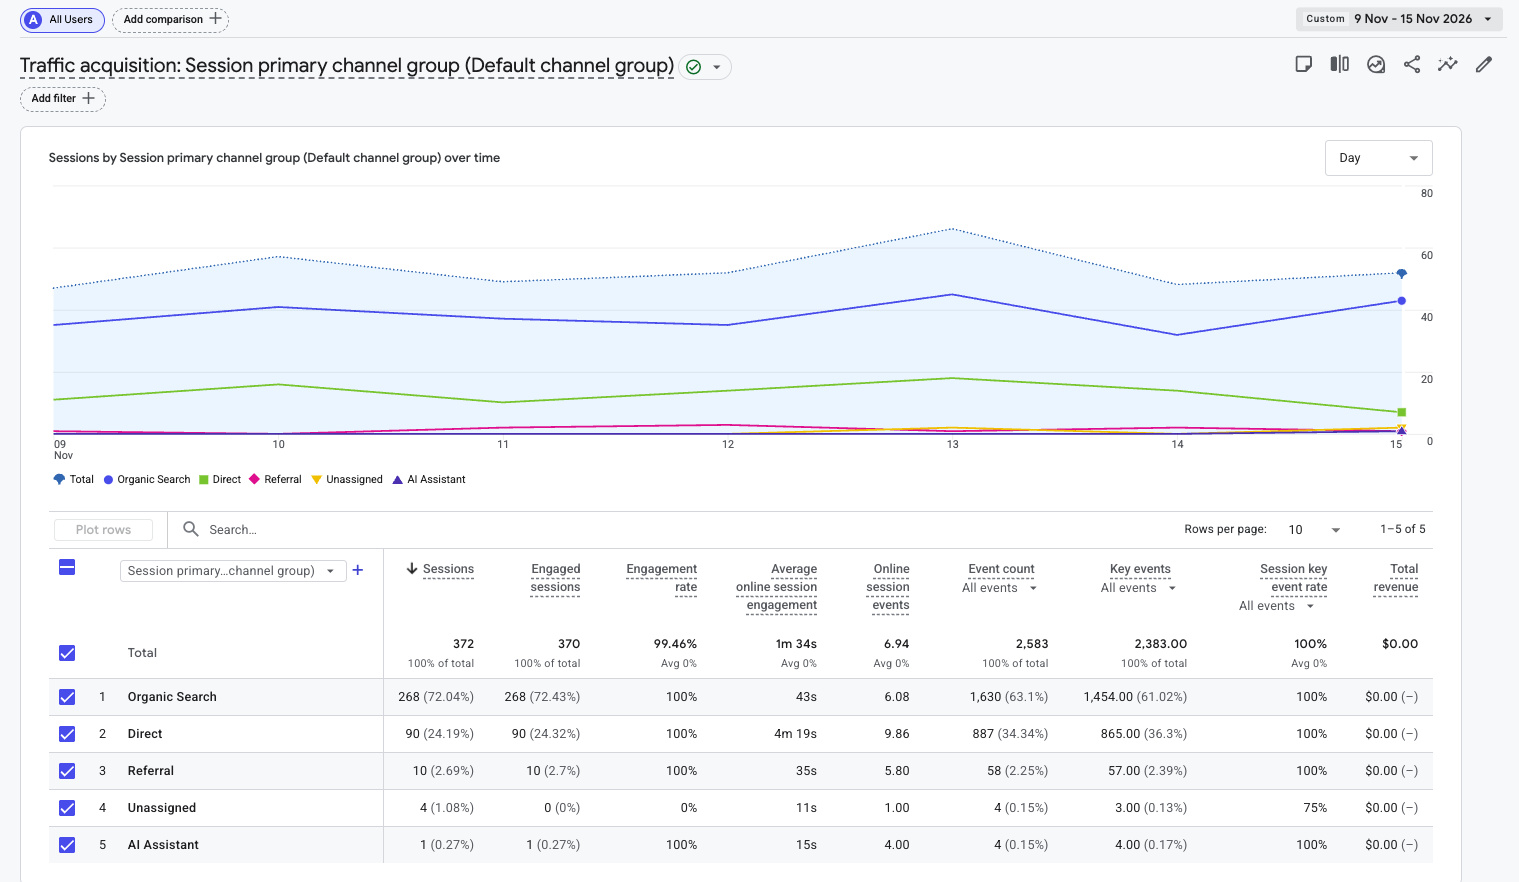
Week 35 recorded 372 sessions, down 2.6%, and 284 active users, down 6.9%. Organic Search rose from 220 to 268 sessions while Direct fell from 155 to 90. Page views reached 851 and Click-to-Shop rose from 98 to 105 actions.
Weekly wins
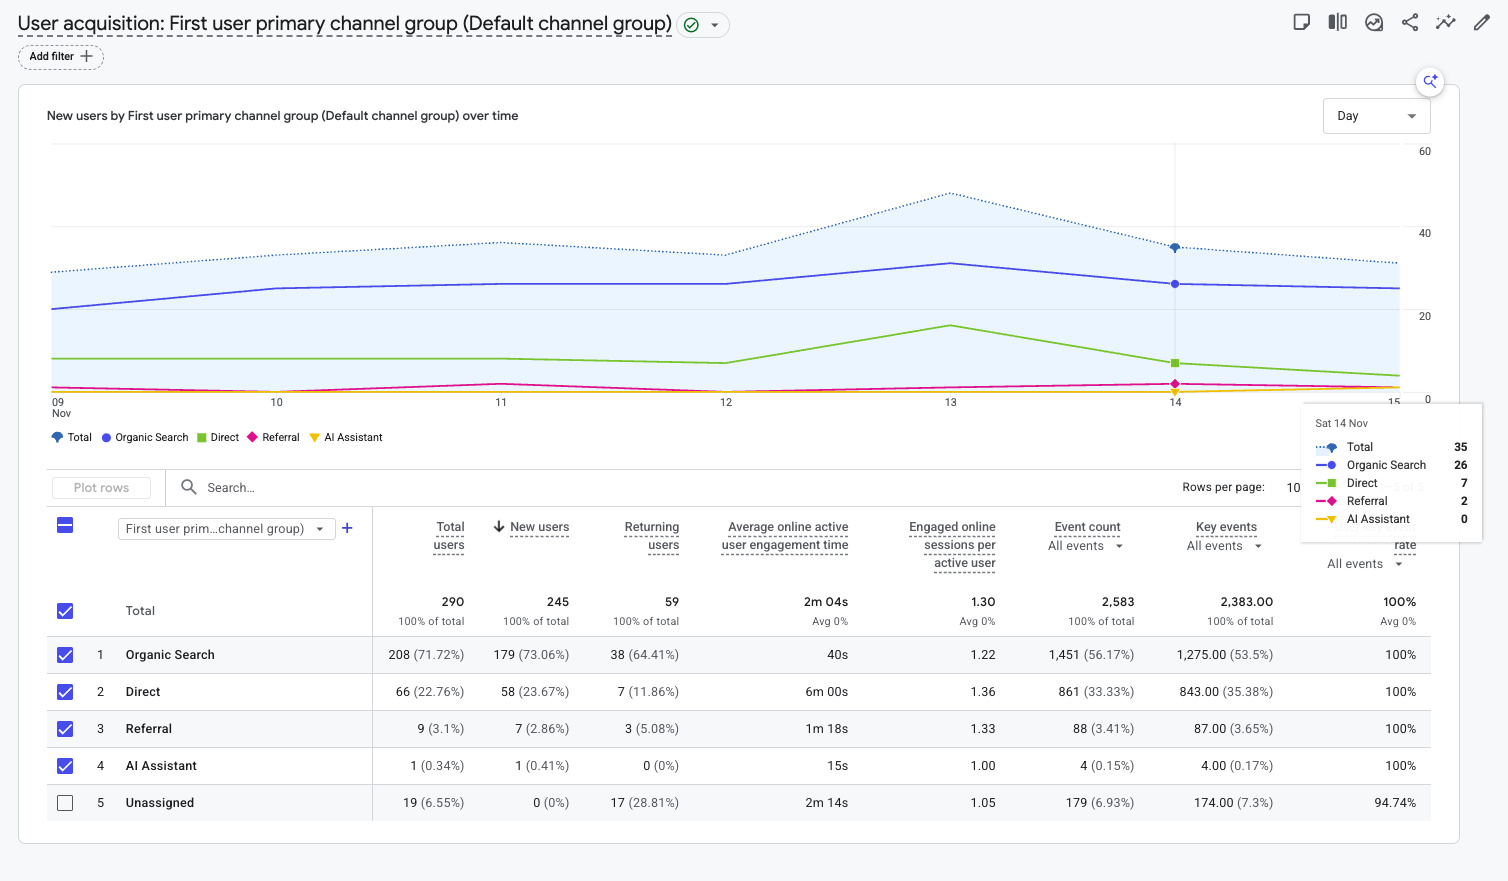
- Organic Search added 48 sessions and brought in 179 new users, up from 150.
- Click-to-Shop rose 7.1% to 105 actions from 70 users, compared with 98 actions from 71 users.
- Page views rose 2.3% to 851 and total events reached 2,583, up 2.5%.
- Guisachan gained 19 page views and Harvey Avenue led all pages with 104 views.
- GA4 recorded 53 form submissions from 37 users, up from 33 submissions from 21 users.
Watch list
- Direct fell by 65 sessions and brought in 58 new users, down from 121.
- The All Stores gateway fell from 102 to 74 views. Vernon 58th Avenue fell from 76 to 51.
- The five channel rows add to 373 sessions. GA4 reports 372 overall.
- Emily Home recorded 26 views from two active users. Check for internal activity before inferring customer reach.
- Routine actions contribute to the 100% session key-event rate.
| Metric | Week 35 | WoW change | Reading |
|---|---|---|---|
| Sessions | 372 | ▼ 2.6% | GA4 Traffic Acquisition headline |
| Engaged sessions | 370 | ▼ 3.1% | GA4 shows a 99.46% engagement rate |
| Active users | 284 | ▼ 6.9% | Weekly active audience |
| New users | 245 | ▼ 10.9% | First-time users |
| Page views | 851 | ▲ 2.3% | All tracked page views |
| Avg engagement / active user | 2m 04s | ▲ 0.4%† | Week 34 displayed 2m 03s |
| Total users | 290 | ▼ 6.1% | 59 returning users, up from 50 |
| Total events | 2,583 | ▲ 2.5% | All recorded events |
| Click-to-Shop | 105 | ▲ 7.1% | 70 users, compared with 71 |
| Key events | 2,383 | ▲ 0.7% | Includes routine website activity |
Percentages compare with the saved Week 34 values. † GA4 engagement-time comparison.
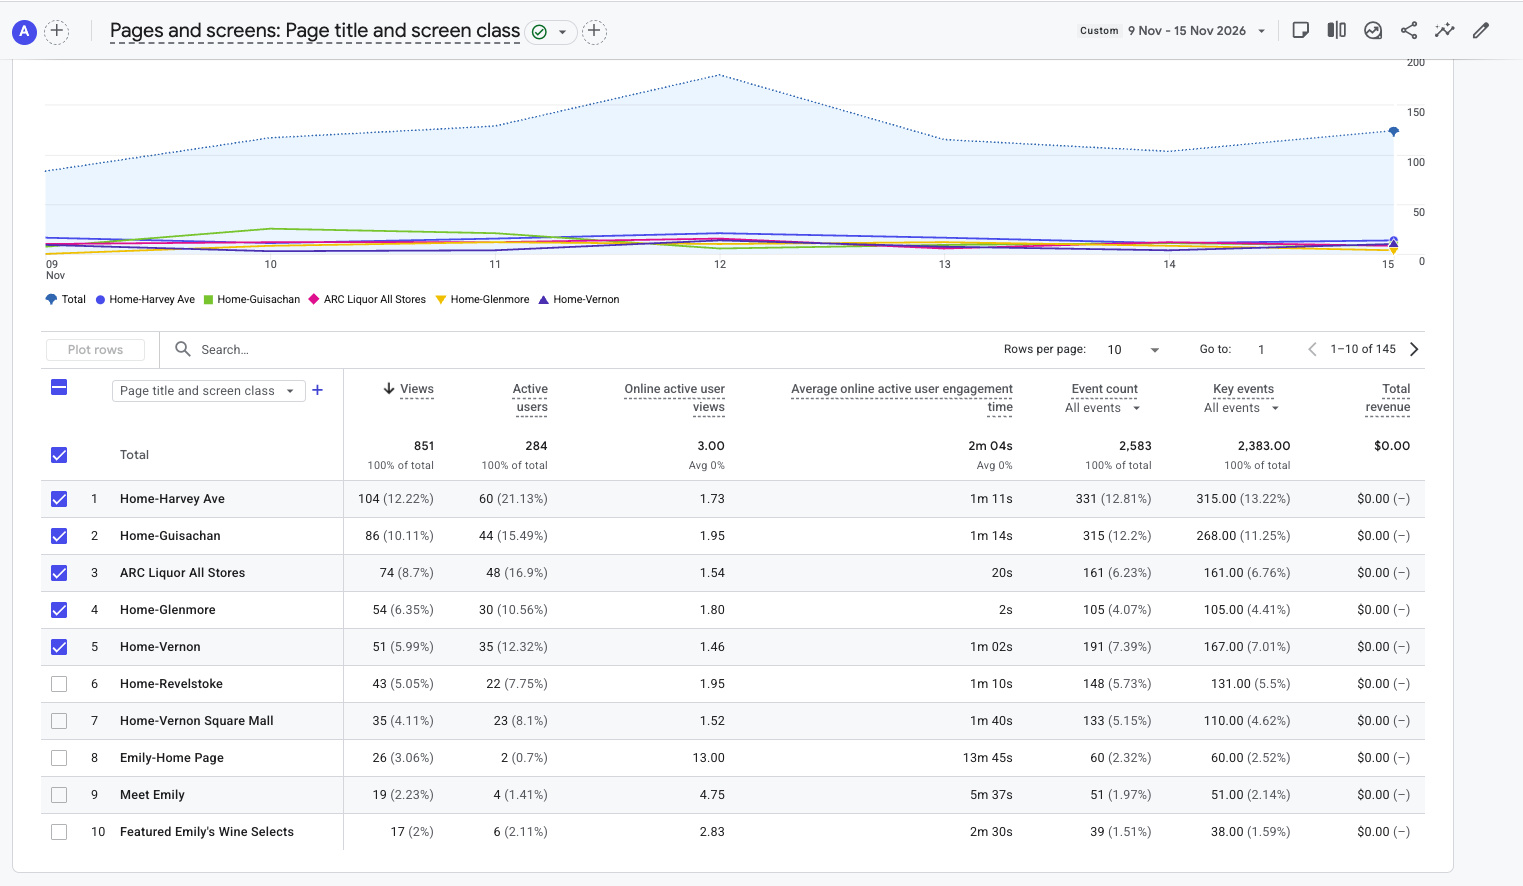
The six store homepages received 373 views, up one from Week 34. Including the All Stores gateway, the seven pages drew 447 views (52.5% of all 851 views).
| Page | Views | Active users | Avg time | Views WoW |
|---|---|---|---|---|
| Harvey Avenue | 104 | 60 | 1m 11s | ▲ 7.2% |
| Guisachan | 86 | 44 | 1m 14s | ▲ 28.4% |
| ARC Liquor All Stores | 74 | 48 | 20s | ▼ 27.5% |
| Glenmore | 54 | 30 | 2s | ▼ 3.6% |
| Vernon 58th Avenue | 51 | 35 | 1m 02s | ▼ 32.9% |
| Revelstoke | 43 | 22 | 1m 10s | ▲ 2.4% |
| Vernon Square Mall | 35 | 23 | 1m 40s | ▲ 2.9% |
| Emily Home | 26 | 2 | 13m 45s | Not shown |
| Meet Emily | 19 | 4 | 5m 37s | Not shown |
| Featured Emily’s Wine Selects | 17 | 6 | 2m 30s | Not shown |
| Channel | Sessions | Share | Engaged | Avg engagement | WoW |
|---|---|---|---|---|---|
| Organic Search | 268 | 72.04% | 268 | 43s | ▲ 21.8% |
| Direct | 90 | 24.19% | 90 | 4m 19s | ▼ 41.9% |
| Referral | 10 | 2.69% | 10 | 35s | ▲ 150.0% |
| Unassigned | 4 | 1.08% | 0 | 11s | 0.0% |
| AI Assistant | 1 | 0.27% | 1 | 15s | ▼ 50.0% |
First-user acquisition: GA4 recorded 245 new users. Organic Search brought 179 (73.1%), Direct 58, Referral seven and AI Assistant one. GA4 counted 290 total users and 59 returning users.
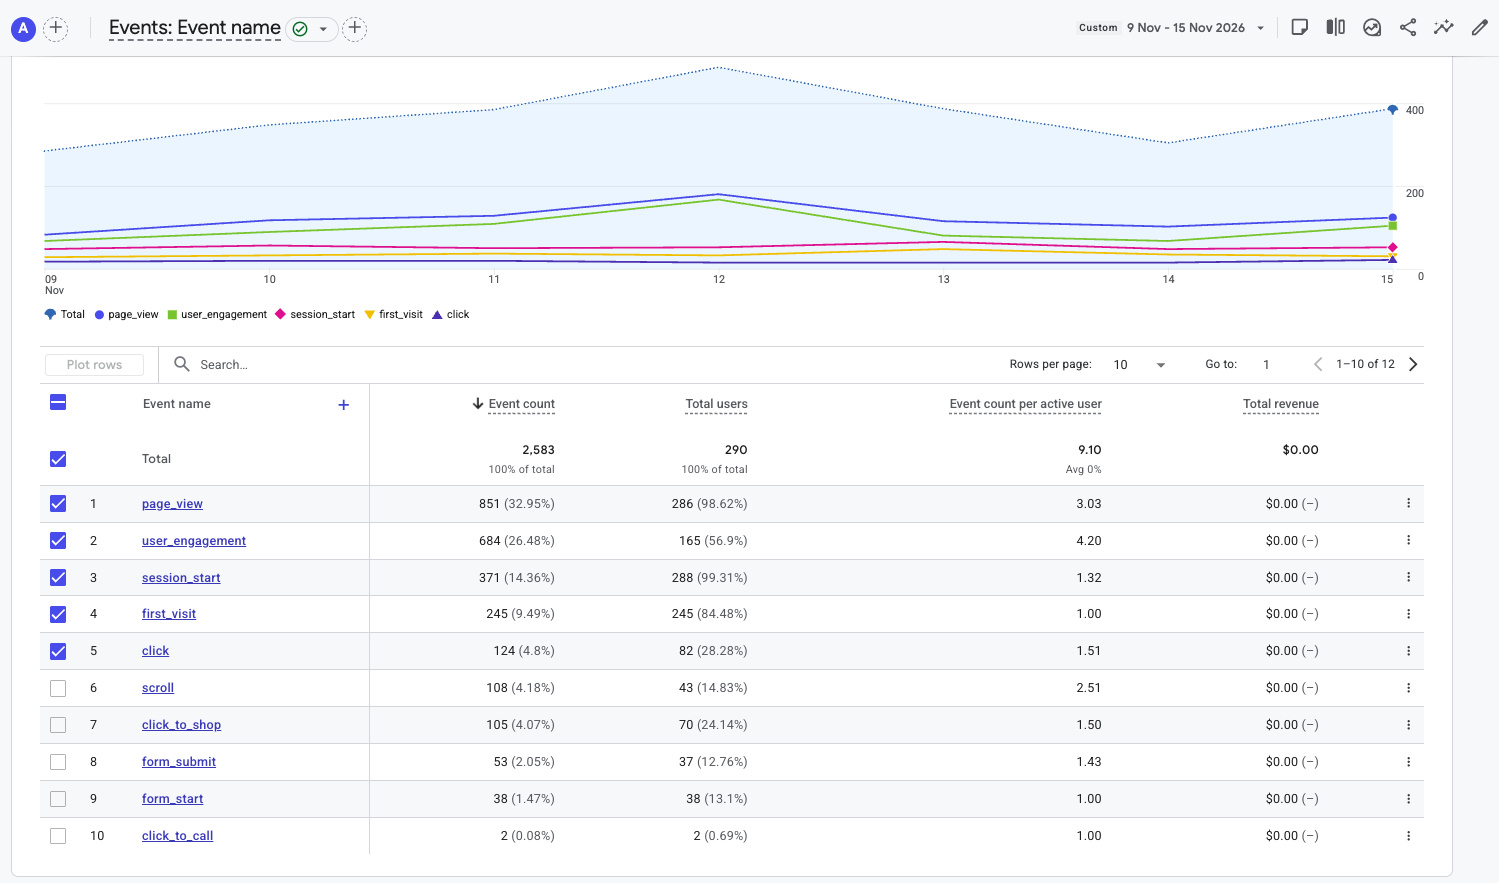
| Event | Count | Users | WoW |
|---|---|---|---|
| page_view | 851 | 286 | ▲ 2.3% |
| user_engagement | 684 | 165 | ▲ 7.5% |
| session_start | 371 | 288 | ▼ 2.9% |
| first_visit | 245 | 245 | ▼ 10.9% |
| click | 124 | 82 | ▲ 13.8% |
| scroll | 108 | 43 | ▼ 18.2% |
| click_to_shop | 105 | 70 | ▲ 7.1% |
| form_submit | 53 | 37 | ▲ 60.6% |
| form_start | 38 | 38 | ▲ 65.2% |
| click_to_call | 2 | 2 | Not shown |
| Measure | Week 35 | Meaning |
|---|---|---|
| Click-to-Shop | 105 / 70 users | Shopping-path actions, up 7.1% |
| Click-to-Product | Not shown | Outside the supplied event rows |
| Key events | 2,383 | Includes routine site activity |
| Session key-event rate | 100% | Share of sessions with a configured key event |
| GA4 revenue | $0.00 | Barnet transactions require separate confirmation |
Form submissions reached 53, across 37 users. Form starts reached 38, across 38 users. Each event has its own count.
- Review landing pages and campaign tagging behind the 65-session Direct decline.
- Use Search Console to identify the search queries and landing pages behind Organic Search growth.
- Check the drop in views for the All Stores gateway and Vernon 58th Avenue.
- Review whether internal activity contributed to the Emily page totals.
- Reconcile the GA4 session channel rows and headline totals.
- Verify form activity against enquiries and check Barnet outcomes where records are available.
More visitors discovered ARC through search, and visitors generated more page views and shopping clicks despite lower overall reach. Click-to-Shop users held near the prior week and Direct accounted for the largest channel decline. Validate the increase in form activity against actual enquiries.
“Search brought more visitors to ARC, and shopping clicks rose even as overall traffic eased.”
Source & comparison notes
Week-over-week percentages use exact counts from the November 9–15 GA4 screenshots and the saved Week 34 report. GA4 cards may use a different snapshot. The Home card shows sessions down 2.9% and engaged sessions down 3.4%. The Traffic card shows Organic Search up 21.3%. † Engagement-time change comes from GA4 because the saved times are rounded. The Events screenshot shows 10 of 12 event rows.
Source — ARC Liquor Stores GA4, November 9–15, 2026, compared with November 2–8, 2026.
GA4 Glossary
Sessions: website visits; distinct from event count. Active users: weekly active audience. New users: first visits. Engagement: measured active time. Click-to-Shop: shopping-path intent, not completed sales. Key events: selected events, including routine actions here. Attribution: first-user and session channels differ.