
Weekly Performance Report
Stable visits, uneven store gains and an engagement measurement alert.
Leadership takeaway
ARC recorded 316 sessions, essentially flat against 317 last week, while page views increased to 619. Harvey (+53.5%), Vernon (+40.0%) and Guisachan (+62.2%) improved. However, Organic Search declined 13.9% and Click-to-Shop fell to 75 actions. The 8m 27s average engagement figure needs validation: Harvey’s 34m 05s per active user strongly suggests internal development and testing activity may influence the headline.
Weekly wins
- Page views rose to 619 (+2.1%).
- Harvey: 109 views (+53.5%).
- Vernon 58th: 70 (+40.0%).
- Guisachan: 60 (+62.2%).
- Direct traffic: 80 sessions (+45.5%).
Watch list
- Organic Search sessions: 216 (▼13.9%).
- Click-to-Shop: 75 events (▼12.8%).
- AI Assistant: 4 sessions (▼66.7%).
- Engagement spike may reflect internal editing and tests.
- Channel sessions total 324 versus 316 headline.
Report download
Full analysis and selected GA4 evidence.
Download Week 32 PDFARC Digital Scorecard
| Area | Direction |
|---|---|
| Reach | Near flat |
| Store pages | Mixed; Harvey/Vernon/Guisachan up |
| Shopping intent | Watch |
| Engagement time | Validate internal traffic |
| Attribution | Reconcile channel rows |
| Metric | Week 32 | WoW change | Reading |
|---|---|---|---|
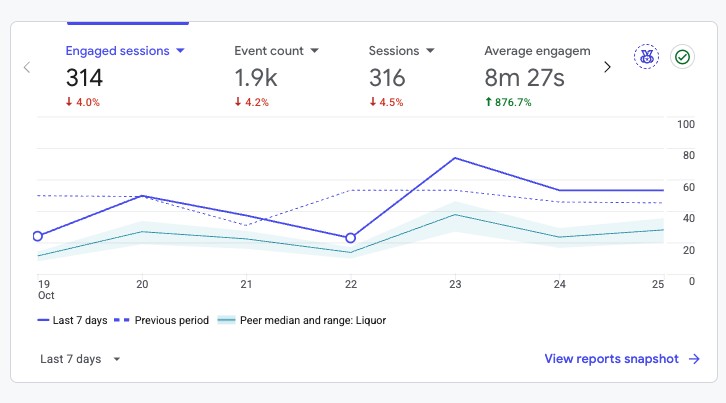
| Sessions | 316 | ▼ 0.3% | Near-flat versus 317 last week |
| Engaged sessions | 314 | ▼ 4.0% | 99.37% reported engagement rate |
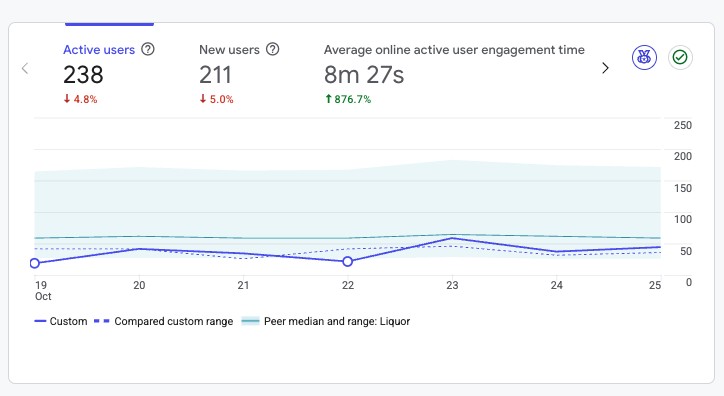
| Active users | 238 | ▼ 4.8% | Card comparison; prior screenshot showed 239 |
| New users | 211 | ▼ 5.0% | Organic new-user discovery softened |
| Page views | 619 | ▲ 2.1% | Higher than last week’s 606 |
| Avg engagement / active user | 8m 27s | ▲ 876.7% | Likely influenced by internal activity; investigate |
| Total users | 249 | Not shown | User Acquisition total |
| Event count | 1,868 | ▼ 0.5% | Versus 1,878 last week |
| Click-to-Shop | 75 | ▼ 12.8% | Versus 86 last week; 56 users |
| Click-to-Product | 10 | Not shown | 5 users; 10 was also reported in prior week where visible |
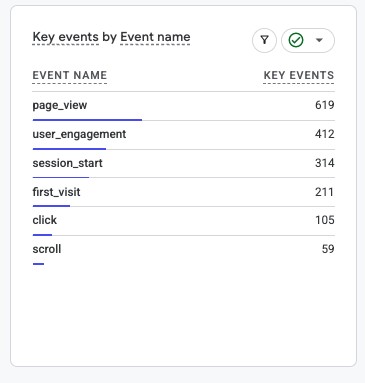
| Key events | 1,720 | Not shown | Broadly configured, not sales |
GA4 comparison-card percentages are reproduced from screenshots. The prior Week 31 table reported 239 active users and 212 new users; this week’s cards display –4.8% and –5.0%, which do not equal the direct one-week differences. Confirm the GA4 comparison-date setup before treating those percentages as reconciled. Sessions and session_start events are different metrics.
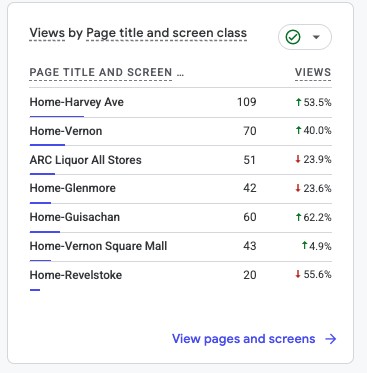
Six store homepages generated 344 views; adding the All Stores gateway (51) gives 395 views, or 63.8% of 619 page views. Page-level active users overlap and should not be summed.
| Page | Views | Active users | Avg. engagement | Views WoW |
|---|---|---|---|---|
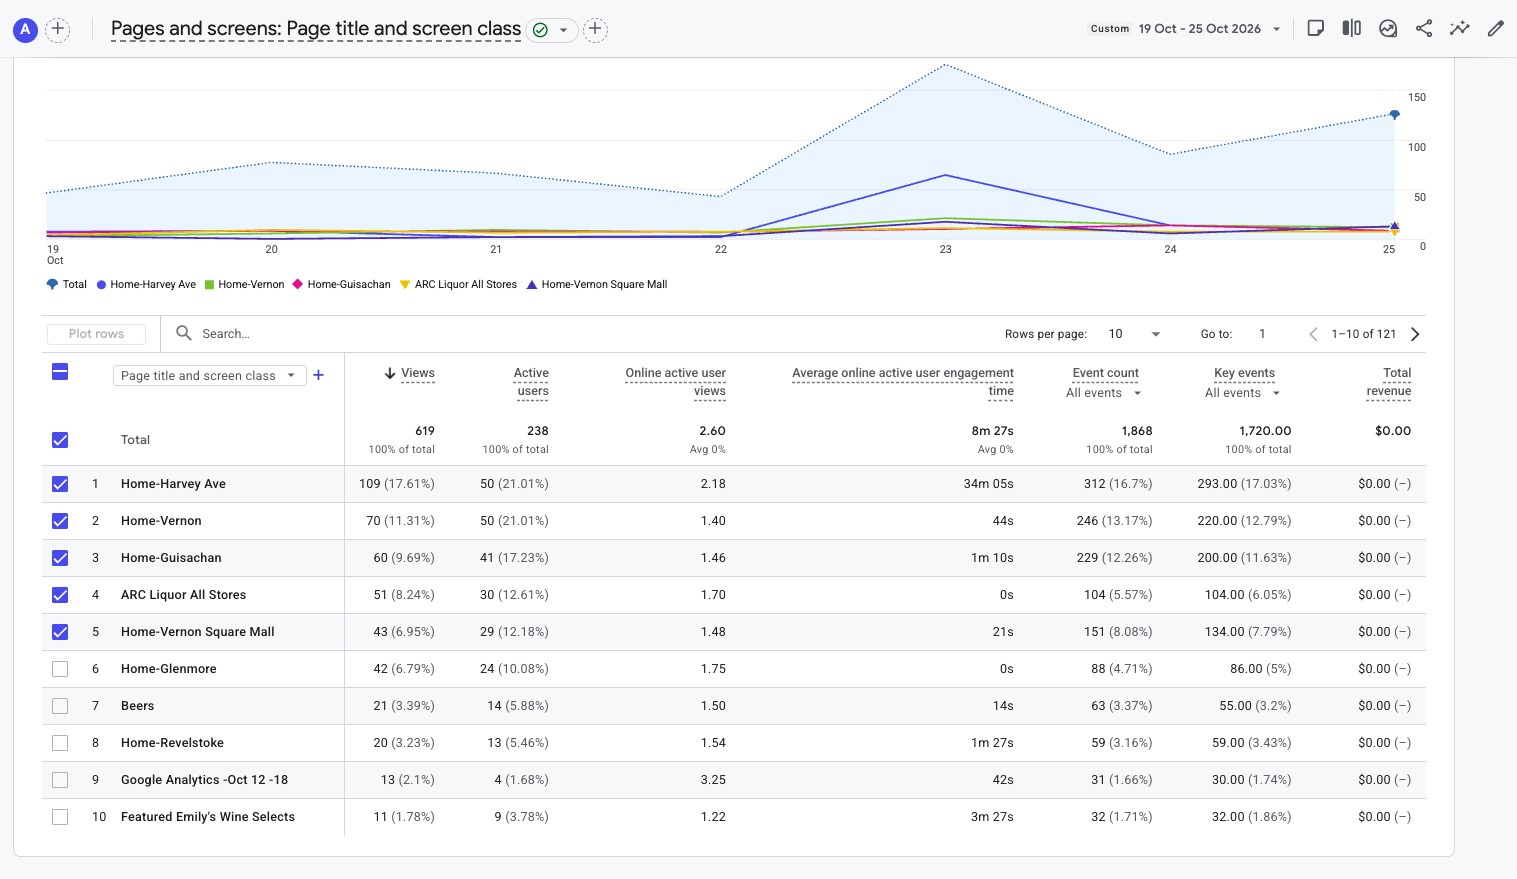
| Harvey Avenue | 109 | 50 | 34m 05s | ▲ 53.5% |
| Vernon 58th Avenue | 70 | 50 | 44s | ▲ 40.0% |
| Guisachan | 60 | 41 | 1m 10s | ▲ 62.2% |
| ARC Liquor All Stores | 51 | 30 | 0s | ▼ 23.9% |
| Vernon Square Mall | 43 | 29 | 21s | ▲ 4.9% |
| Glenmore | 42 | 24 | 0s | ▼ 23.6% |
| Beers | 21 | 14 | 14s | Not shown |
| Revelstoke | 20 | 13 | 1m 27s | ▼ 55.6% |
| GA4 Oct 12–18 | 13 | 4 | 42s | Not shown |
| Featured Emily’s Wine Selects | 11 | 9 | 3m 27s | Not shown |
Harvey shows 34m 05s average engagement across 50 active users, while the overall property reports 8m 27s. This is an unusually concentrated engagement pattern. Work on the Andrew/Anderru pages and other website editing is known to involve internal testing. GA4 evidence alone does not prove all engagement is internal, but the spike must not be represented as customer behaviour until internal traffic is isolated.
| Channel | Sessions | GA4 share | Engaged | Avg. engagement / session | WoW |
|---|---|---|---|---|---|
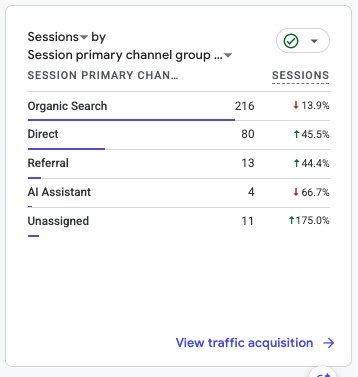
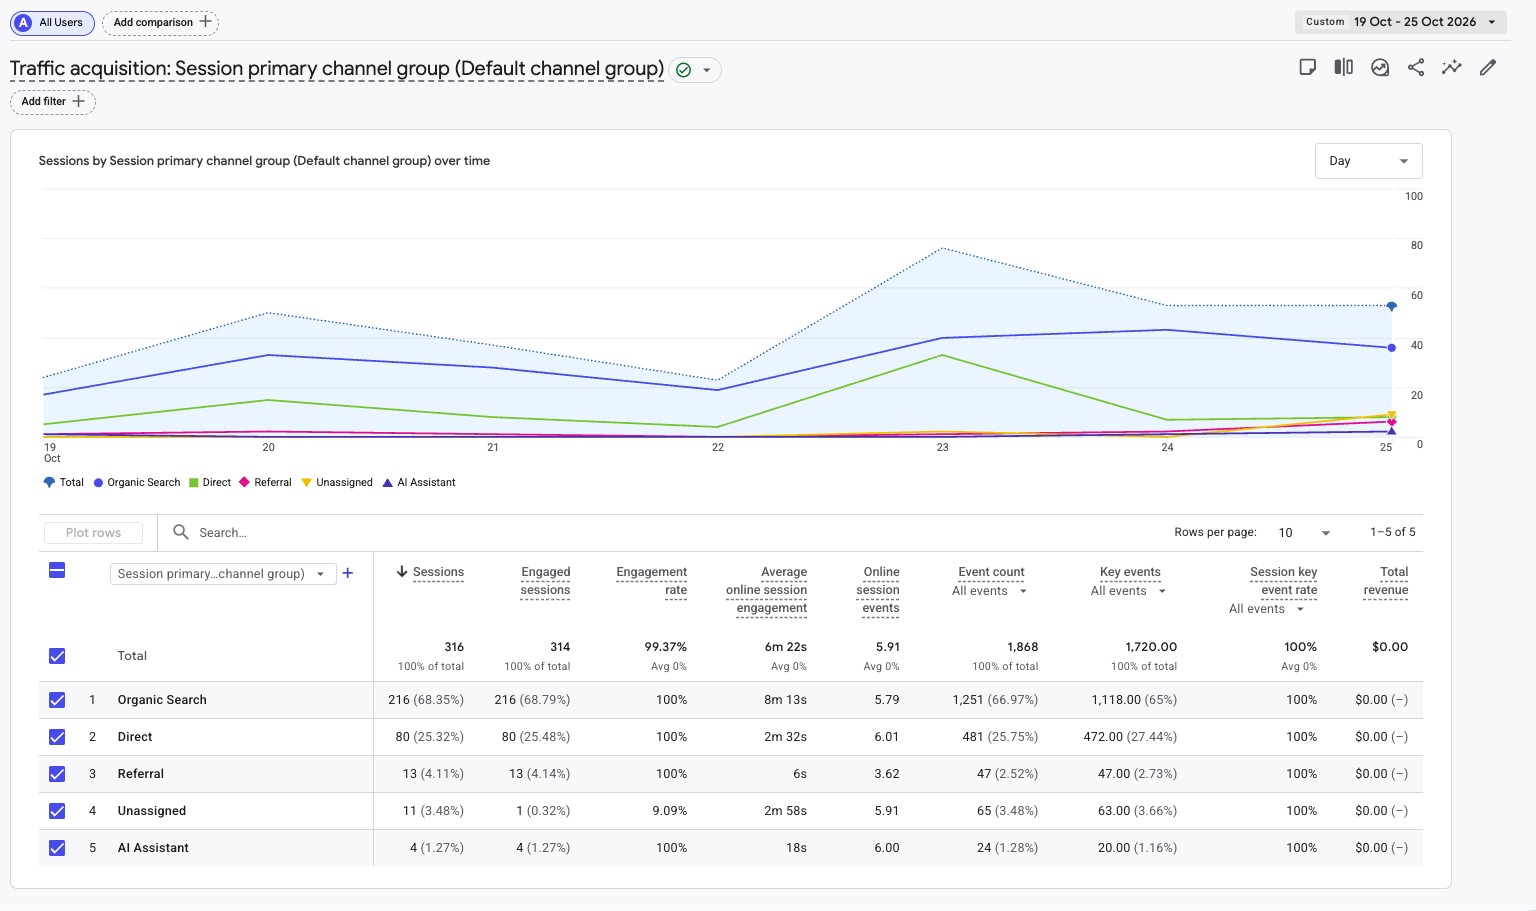
| Organic Search | 216 | 68.35% | 216 | 8m 13s | ▼ 13.9% |
| Direct | 80 | 25.32% | 80 | 2m 32s | ▲ 45.5% |
| Referral | 13 | 4.11% | 13 | 6s | ▲ 44.4% |
| Unassigned | 11 | 3.48% | 1 | 2m 58s | ▲ 175.0% |
| AI Assistant | 4 | 1.27% | 4 | 18s | ▼ 66.7% |
Displayed channel rows total 324 sessions against GA4’s 316 headline; their displayed shares sum to 102.53%. Engaged-session rows total 314, matching the headline. Retain figures as supplied and review acquisition attribution/export before using the channel shares as a reconciled distribution.
First-time discovery
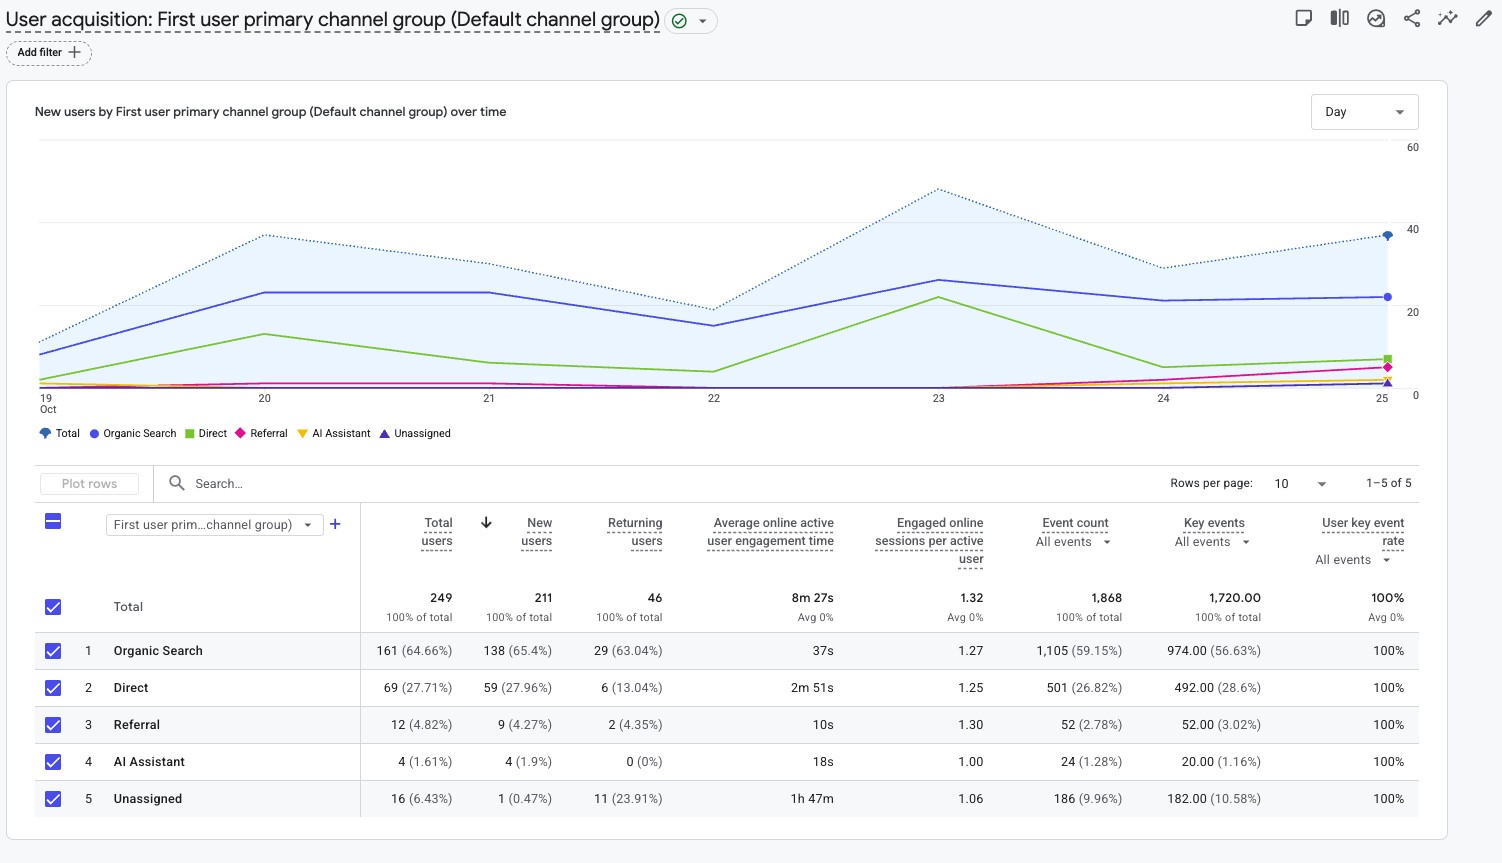
User Acquisition reports 211 new users, including 138 Organic Search, 59 Direct, nine Referral, four AI Assistant and one Unassigned. These first-user channels are a different scope from session acquisition.
| Event | Count | Users | WoW |
|---|---|---|---|
| page_view | 619 | 247 | ▲ 2.1% |
| user_engagement | 412 | 138 | ▲ 3.3% |
| session_start | 314 | 247 | ▼ 0.3% |
| first_visit | 211 | 211 | ▼ 0.5% |
| click | 105 | 77 | ▼ 0.9% |
| click_to_shop | 75 | 56 | ▼ 12.8% |
| scroll | 59 | 30 | ▼ 16.9% |
| form_submit | 33 | 27 | Not shown |
| form_start | 28 | 27 | Not shown |
| click_to_product | 10 | 5 | Not shown |
Page views edged up to 619, but Click-to-Shop decreased to 75 and scrolls fell to 59. Form submissions were 33 events involving 27 users, and form starts were 28 involving 27 users; event counts do not establish verified leads or a completion rate.
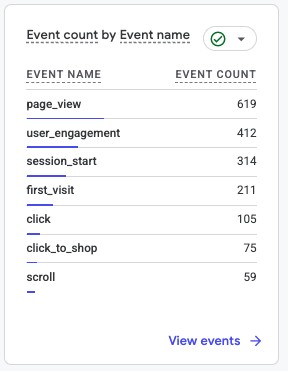
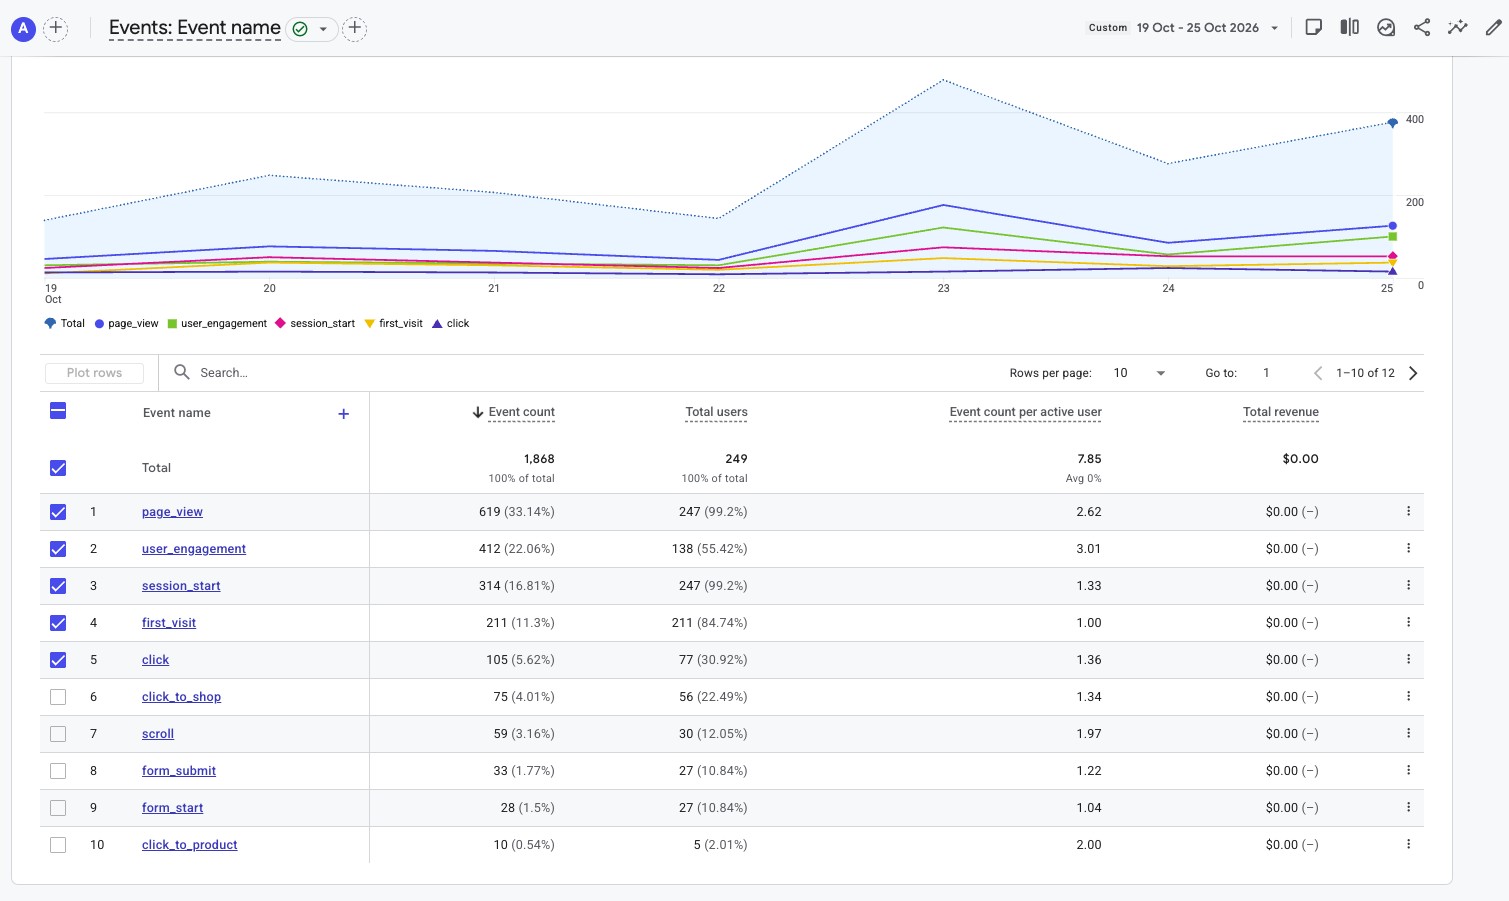
Click-to-Shop recorded 75 events across 56 users, while Click-to-Product recorded 10 events across five users. These are shopping-path actions, not completed purchases. GA4 key events total 1,720 because routine activity is marked as key events; a 100% session key-event rate is not a commercial conversion rate.
| Measure | Week 32 | Meaning |
|---|---|---|
| Click-to-Shop | 75 events / 56 users | ▼12.8%; shopping-path intent |
| Click-to-Product | 10 / 5 users | Product-level intent |
| Key events | 1,720 | Broadly configured, not sales |
| GA4 revenue | $0 | External and in-store sales not measured here |
- Exclude internal testing: configure and validate internal/developer traffic filters, particularly Harvey and Andrew/Anderru work.
- Protect Organic Search: audit landing pages and local query trends behind the 13.9% drop.
- Improve shopping intent: investigate Click-to-Shop decline to 75 actions.
- Review attribution: reconcile 324 channel-row sessions against 316 headline sessions.
- Build on store-page gains: investigate the Harvey, Vernon and Guisachan improvements.
- Review AI acquisition: four sessions this week; small sample.
- Audit key events: separate routine behaviour from commercial intent.
ARC recorded 316 sessions, essentially flat against 317 last week, while page views increased to 619. Harvey (+53.5%), Vernon (+40.0%) and Guisachan (+62.2%) improved. However, Organic Search declined 13.9% and Click-to-Shop fell to 75 actions. The 8m 27s average engagement figure needs validation: Harvey’s 34m 05s per active user strongly suggests internal development and testing activity may influence the headline.
“The audience held nearly steady, store-page interest strengthened in Harvey, Vernon and Guisachan, but internal testing must be separated from true customer engagement.”
Source & comparison notes
ARC GA4 screenshots, October 19–25, 2026; comparison October 12–18. Exact table values used where provided. The comparison cards have some inconsistencies against prior screenshot totals. The 8m 27s average is not validated customer-only engagement. No purchase revenue inference is made.