
ARC Liquor Stores
Weekly Reporting • GA4 + Intent Tracking
Weekly Performance Report
A weekly leadership snapshot covering traffic, engagement, store-page performance, acquisition channels and customer-intent actions across ARC's connected digital platform.
Alongside the established Gold Standard report, an enhanced leadership layout is available with a visual scorecard, trend tracker and expanded interpretation.
Leadership takeaway (Week 24)
Week 24 brought a clear reduction in reach, with 344 sessions (▼21.3%), 337 engaged sessions (▼22.9%), 261 active users (▼23.7%) and 221 new users (▼28.0%). Organic Search also softened to 260 sessions (▼24.4%).
The more encouraging story sits beneath the headline decline. Average engagement increased to 1m 09s (▲40.5%), total clicks remained almost unchanged at 140 (▼1.4%), and Click-to-Shop increased slightly to 112 (▲0.9%). ARC therefore generated almost the same level of customer action from a considerably smaller audience.
Week 24 was not simply a weaker traffic week. Reach declined, but the visitors who did arrive were more engaged and produced unusually resilient shopping activity. The immediate priority is to recover Organic Search reach while preserving this stronger visitor quality.
Weekly wins
- Average engagement: increased 40.5% to 1m 09s.
- Click-to-Shop: 112 actions, slightly above last week's 111 despite materially lower traffic.
- Clicks: 140, down only 1.4% while sessions declined 21.3%.
- Referral traffic: 27 sessions, up 107.7%, with 4m 12s average engagement.
- Revelstoke: page views increased 20.0% to 42.
Watch list
- Organic Search: 260 sessions, down 24.4%.
- New users: 221, down 28.0%.
- Active users: 261, down 23.7%.
- AI Assistant: 13 sessions, down 35.0%.
- Unassigned: 17 sessions remain an attribution issue.
PDF report download
The PDF contains the complete Week 24 analysis, supporting GA4 screenshots, acquisition data, store-page performance, event tracking and recommended actions.
Sessions: 344 • Avg. Engagement: 1m 09s • Clicks: 140 • Click-to-Shop: 112| Metric | Week 24 | WoW change |
|---|---|---|
| Active users | 261 | ▼ 23.7% |
| New users | 221 | ▼ 28.0% |
| Sessions | 344 | ▼ 21.3% |
| Engaged sessions | 337 | ▼ 22.9% |
| Page views | 673 | ▼ 22.4% |
| Average engagement time | 1m 09s | ▲ 40.5% |
| Total events | 2,100 | ▼ 22.0% |
| Key events | 1,867 | ▼ 23.6% |
| Click-to-Shop | 112 | ▲ 0.9% |
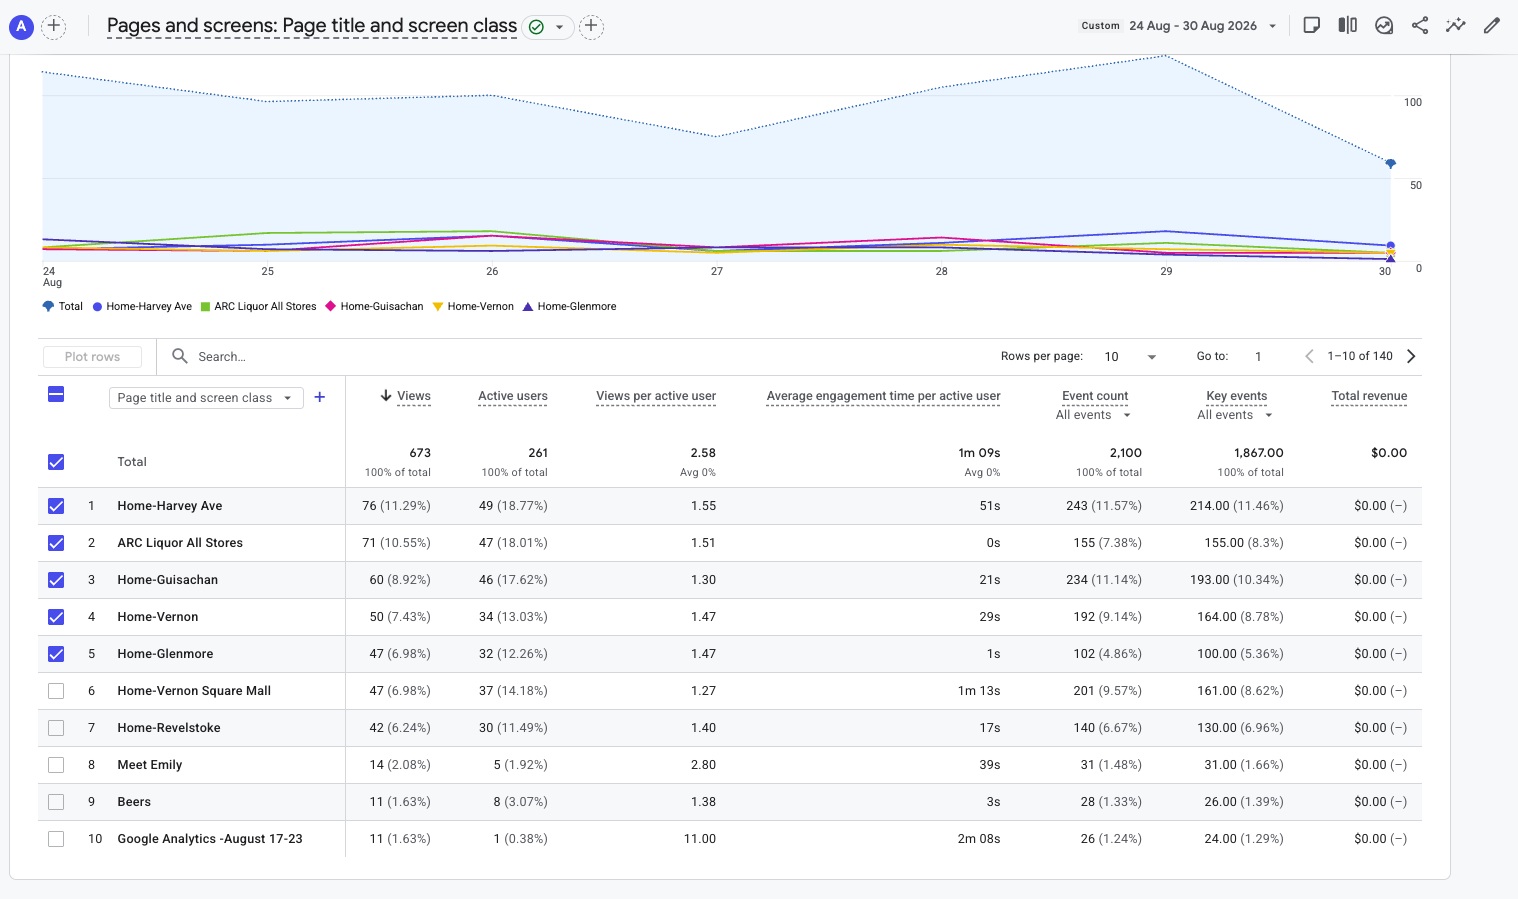
Store-page traffic was softer across much of the network, reflecting the overall reduction in reach. Harvey remained the leading store homepage, while Revelstoke was the notable exception and increased week over week.
| Page | Views | WoW note |
|---|---|---|
| Home-Harvey Ave | 76 | ▼ 26.9% |
| ARC Liquor All Stores | 71 | ▼ 17.4% |
| Home-Guisachan | 60 | ▼ 15.5% |
| Home-Vernon | 50 | ▼ 31.5% |
| Home-Glenmore | 47 | ▼ 19.0% |
| Home-Vernon Square Mall | 47 | ▼ 4.1% |
| Home-Revelstoke | 42 | ▲ 20.0% |
| Meet Emily | 14 | Early baseline |
The page-level softness broadly mirrors the traffic decline rather than pointing to one isolated store issue. Revelstoke moved against the wider trend, while Meet Emily remained visible in the top ten and continues to provide an early baseline for the developing Emily customer journey.
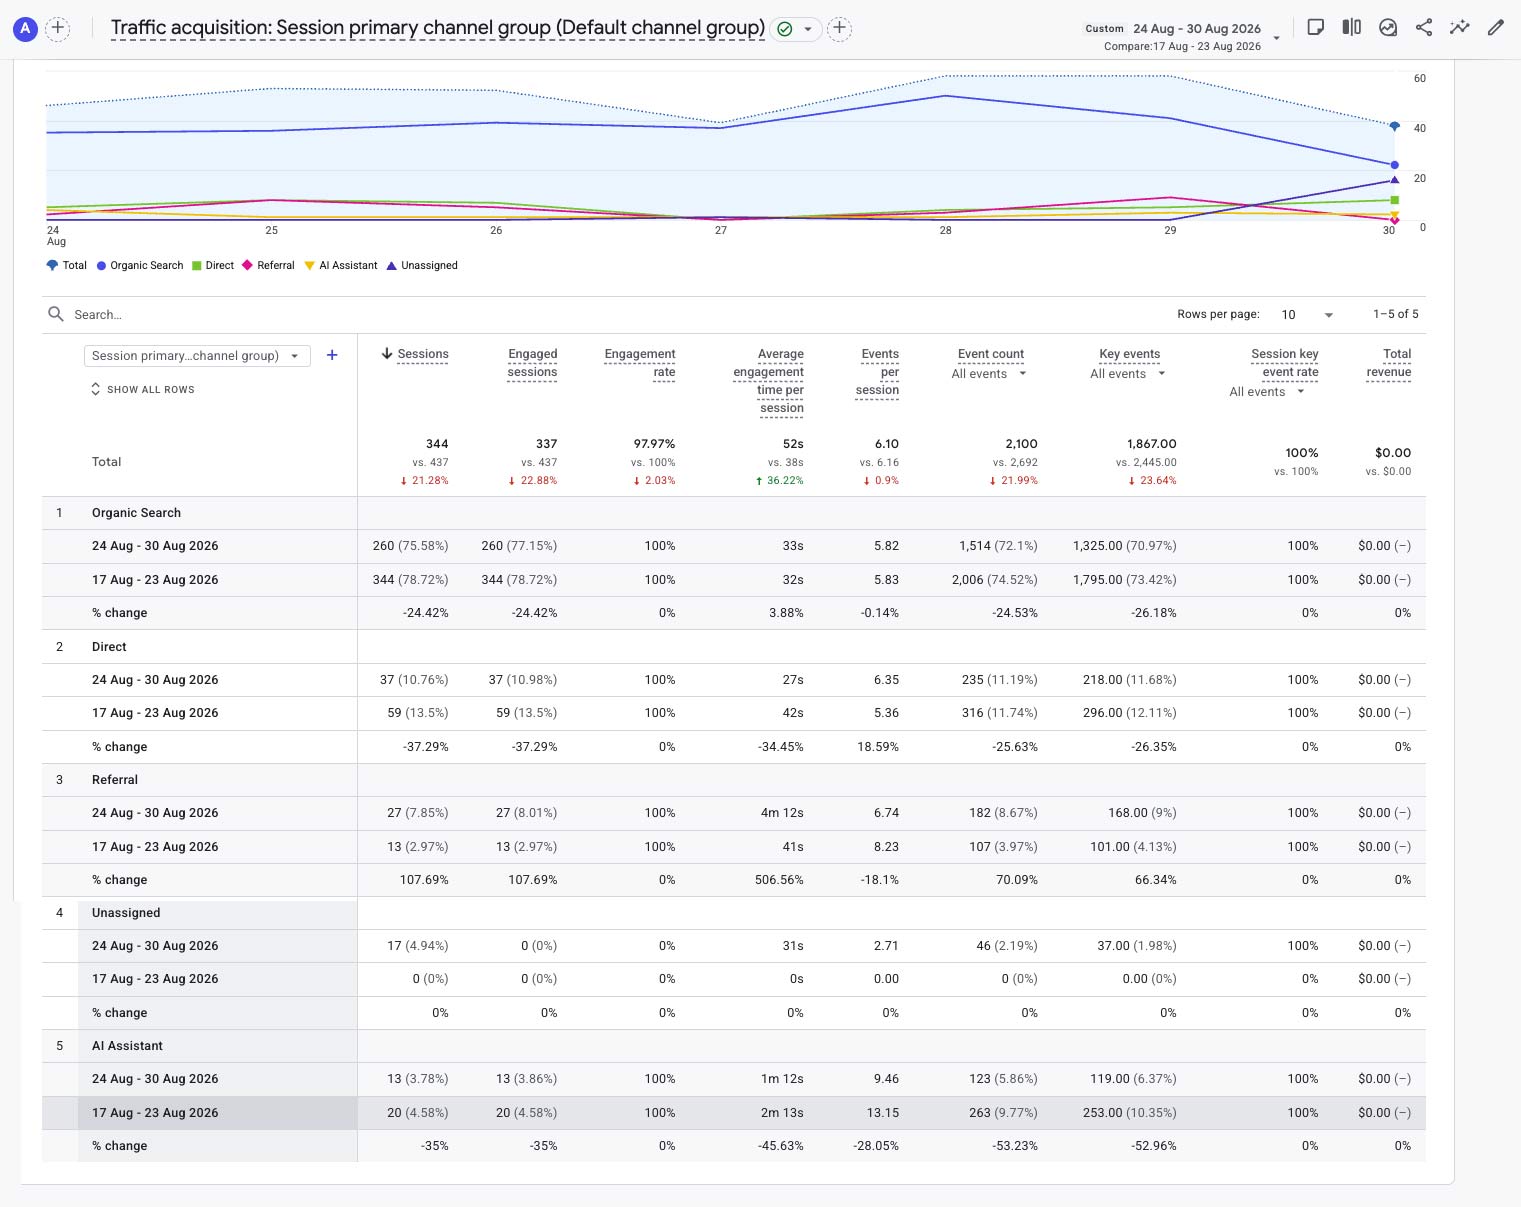
| Channel | Sessions | WoW note |
|---|---|---|
| Organic Search | 260 | ▼ 24.4% |
| Direct | 37 | ▼ 37.3% |
| Referral | 27 | ▲ 107.7% |
| Unassigned | 17 | Attribution review |
| AI Assistant | 13 | ▼ 35.0% |
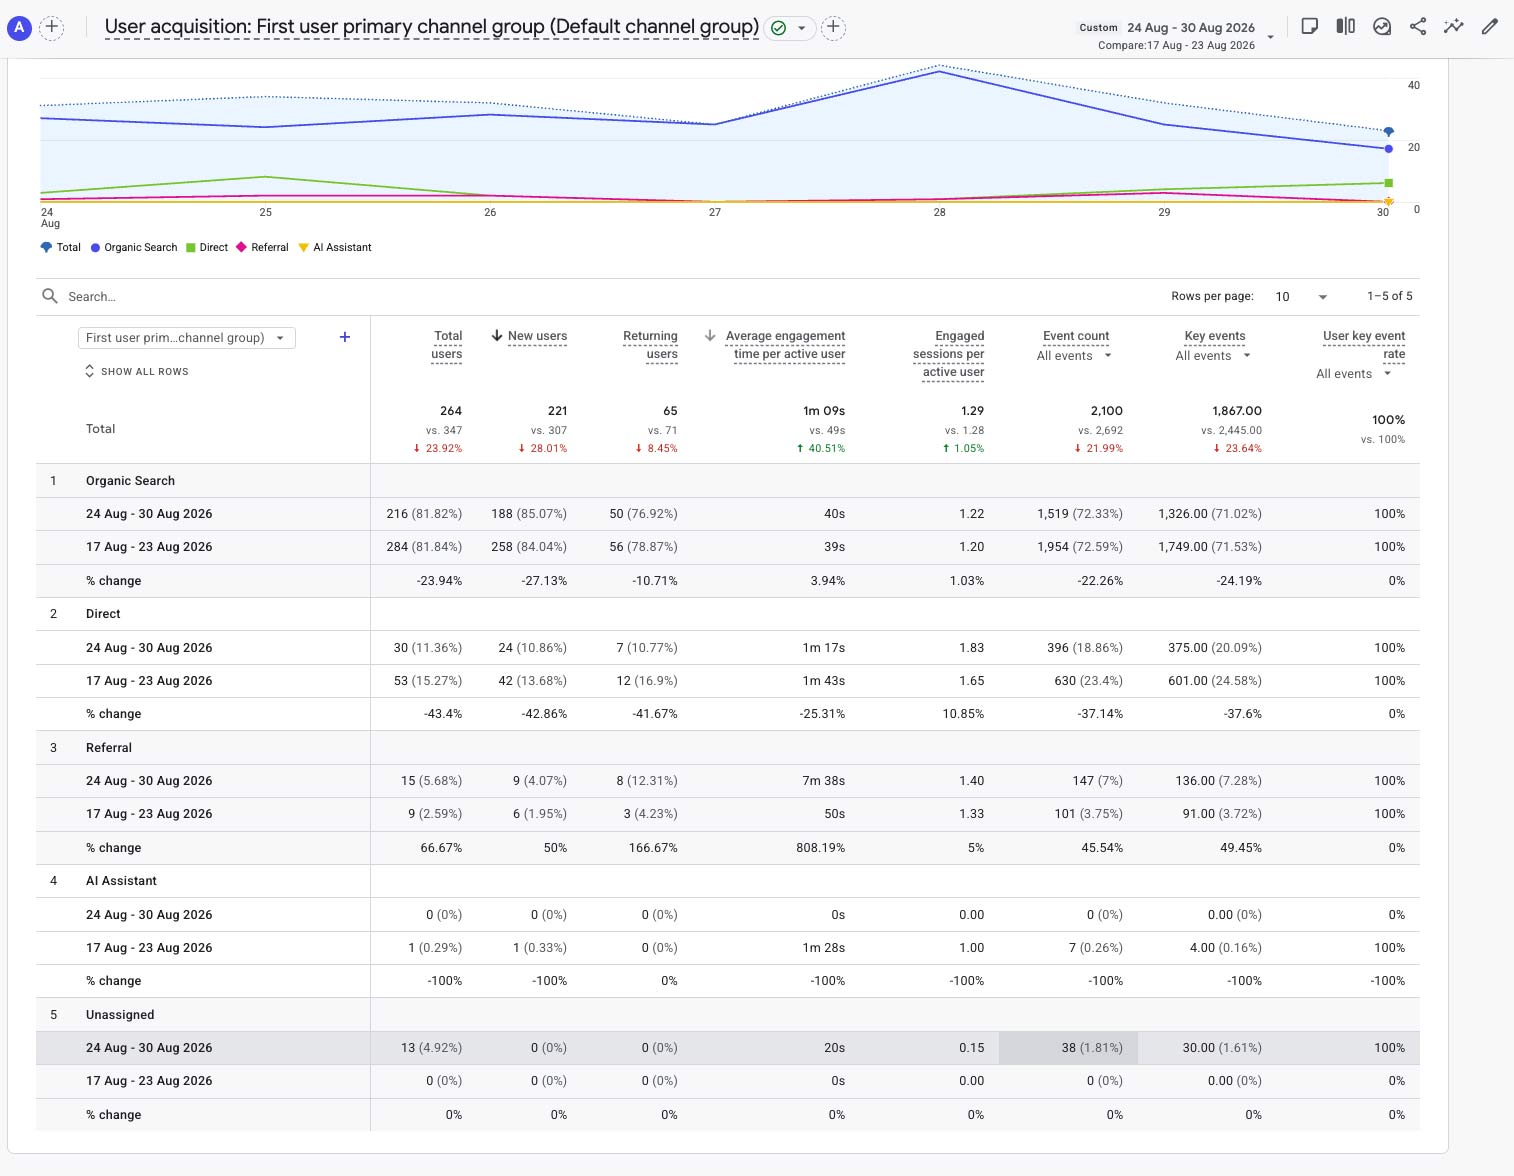
Organic Search remains ARC's foundation at 75.6% of sessions, but its 24.4% weekly decline explains much of the reduction in overall reach. Referral was the bright spot, more than doubling to 27 sessions and recording 4m 12s average engagement. The sample is still small, so the source should be investigated rather than over-interpreted.
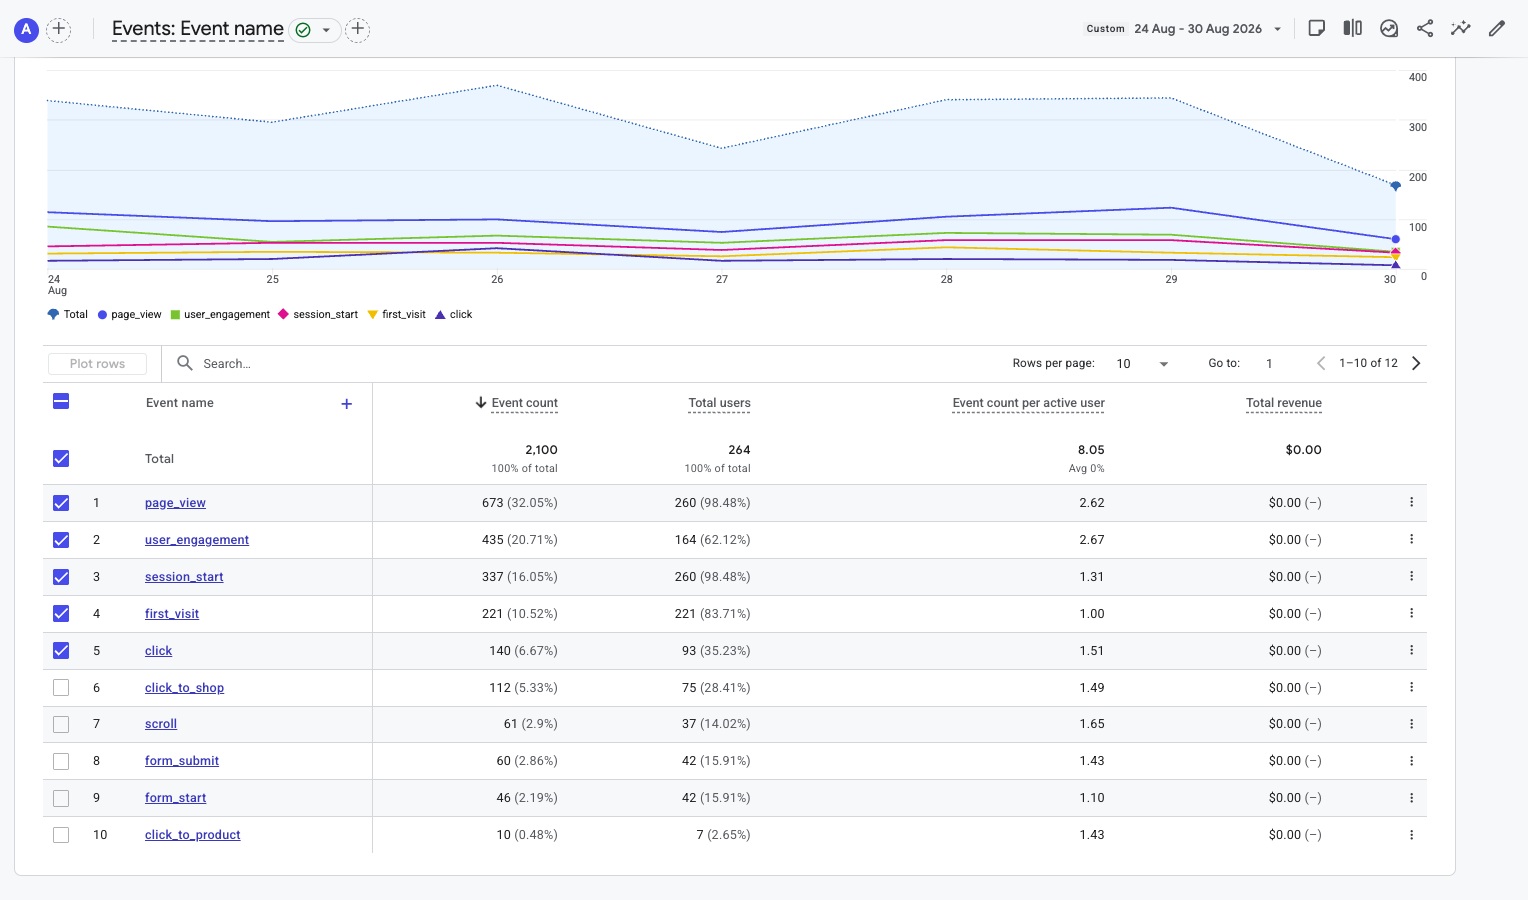
| Event | Week 24 | WoW change |
|---|---|---|
| page_view | 673 | ▼ 22.4% |
| user_engagement | 435 | ▼ 26.3% |
| session_start | 337 | ▼ 22.0% |
| first_visit | 221 | ▼ 27.5% |
| click | 140 | ▼ 1.4% |
| click_to_shop | 112 | ▲ 0.9% |
| scroll | 61 | ▼ 17.6% |
| form_submit | 60 | ▼ 10.4% |
| form_start | 46 | ▼ 8.0% |
| click_to_product | 10 | ▼ 33.3% |
Volume-based events naturally fell with the smaller audience, but commercial activity was more resilient. Total clicks were almost unchanged and Click-to-Shop edged higher, suggesting stronger action density among the visitors who reached ARC.
Click-to-Shop: 112 actions, up 0.9%. Click-to-Product: 10 actions, down 33.3%. Form submissions: 60, down 10.4%. Total clicks: 140, down only 1.4%.
Week 24's most important commercial signal is resilience. Sessions fell 21.3%, yet Click-to-Shop held slightly above the previous week. On a per-session basis, Click-to-Shop activity increased from roughly 25.4% to 32.6%, indicating a more purposeful audience.
- Recover Organic Search reach: investigate the 24.4% weekly decline in Organic sessions and the lower volume across several branded search queries.
- Protect conversion efficiency: preserve the stronger Click-to-Shop activity relative to traffic as reach recovers.
- Investigate Referral growth: identify which sources generated the 27 Referral sessions and unusually high engagement.
- Monitor Emily: continue establishing a clean baseline for Meet Emily and the broader wine-discovery journey.
- Review AI Assistant: track the smaller but still measurable 13-session acquisition source without over-interpreting short-term volatility.
- Attribution cleanup: continue investigating Unassigned traffic and tagging consistency.
Week 24 brought fewer visitors, but the traffic that remained showed stronger engagement and unusually resilient shopping behaviour. Organic Search weakness explains much of the reduction in reach and should be the primary watch item. At the same time, average engagement improved substantially, Referral traffic strengthened, clicks remained almost flat and Click-to-Shop edged higher. ARC's opportunity is to restore audience volume without losing this stronger visitor quality.
Week 24 brought fewer visitors, but stronger intent — ARC generated virtually the same customer actions from a considerably smaller audience.
You can view the graphs and read the full analysis in the PDF report.
Click to download this reportGA4 Glossary (quick reference)
A quick guide to the core metrics used in this report.
Active users
Unique people who actively visited during the reporting window.
New users
First-time visitors in the reporting window.
Sessions
Total visits. One person can generate multiple sessions.
Engaged sessions
Sessions where the visitor showed meaningful engagement.
Event count
Total tracked interactions, including views, clicks, scrolls, forms and shopping actions.
Key events
Events marked as important in GA4 for conversion-style reporting.