Enhanced Leadership Performance Report
A leadership-focused interpretation of ARC's digital performance, customer intent, acquisition quality and emerging opportunities.
ARC Digital Scorecard
Overall reach softened, but visitor quality and shopping efficiency remained stronger than the headline traffic numbers suggest. This score is an analytical summary rather than a native GA4 metric.
| Area | Status | Assessment |
|---|---|---|
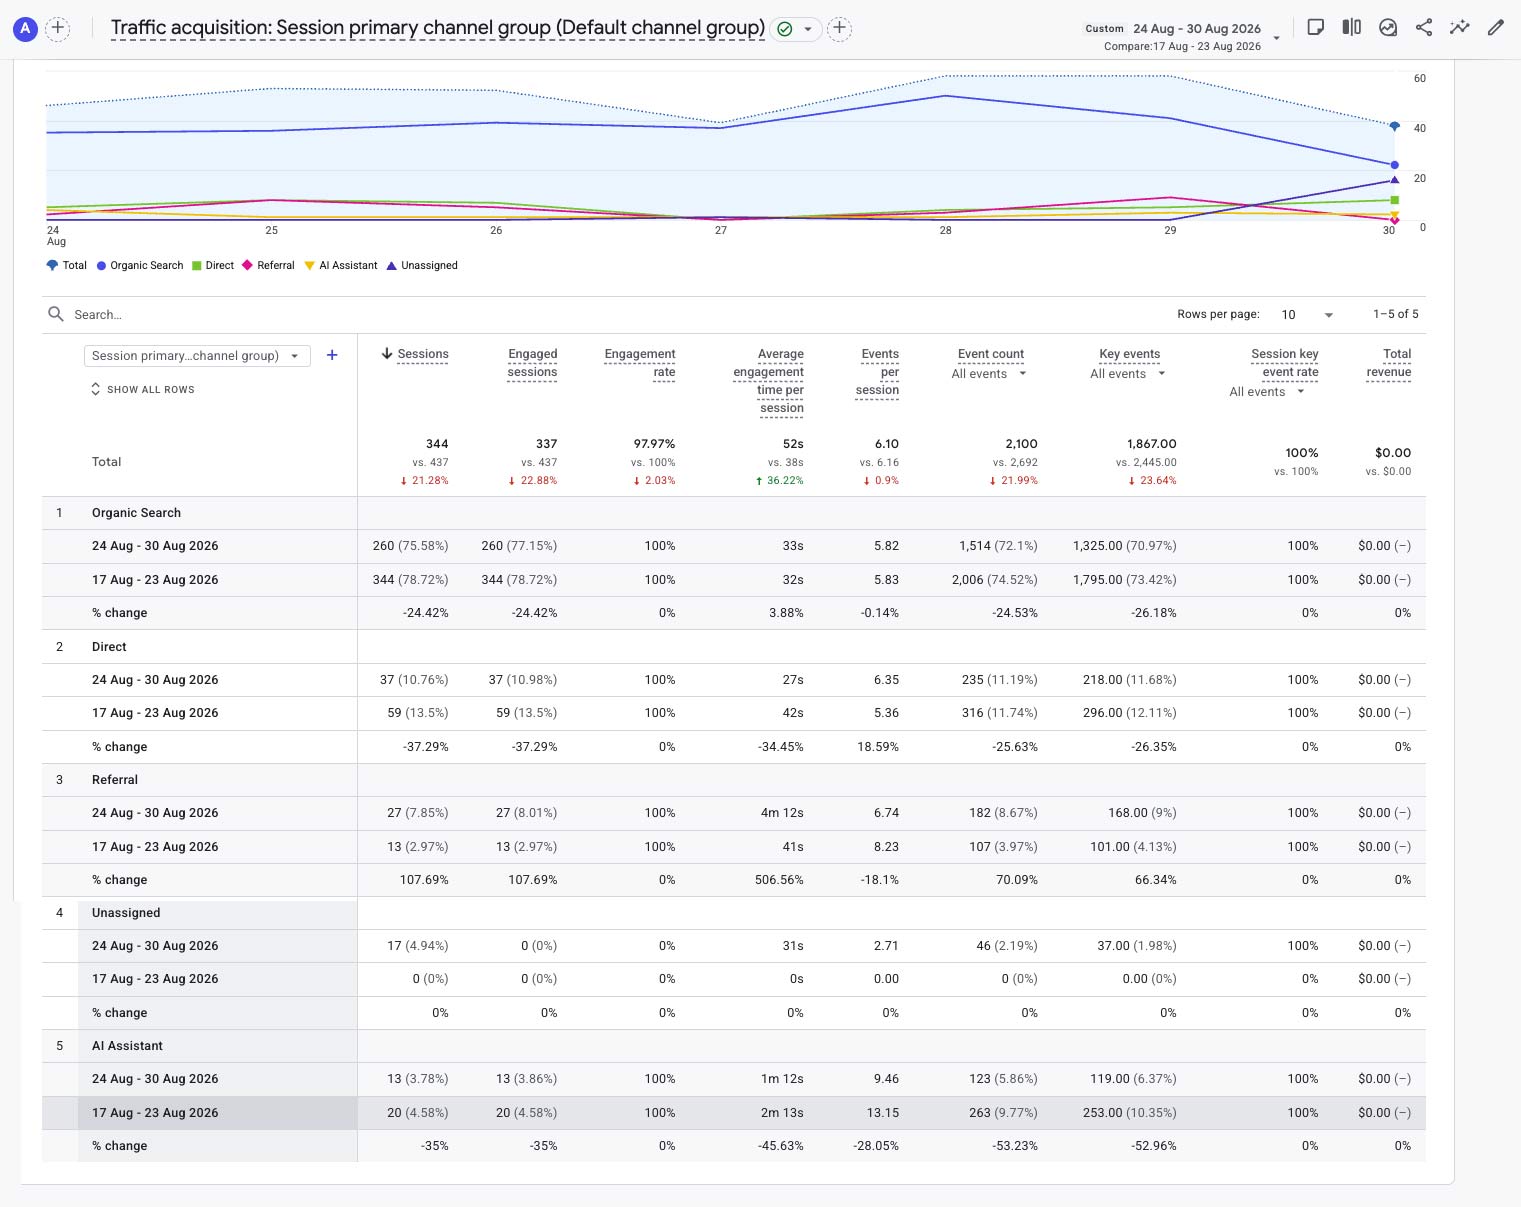
| SEO Momentum | Watch | Organic sessions declined 24.4% and branded-query volume softened. |
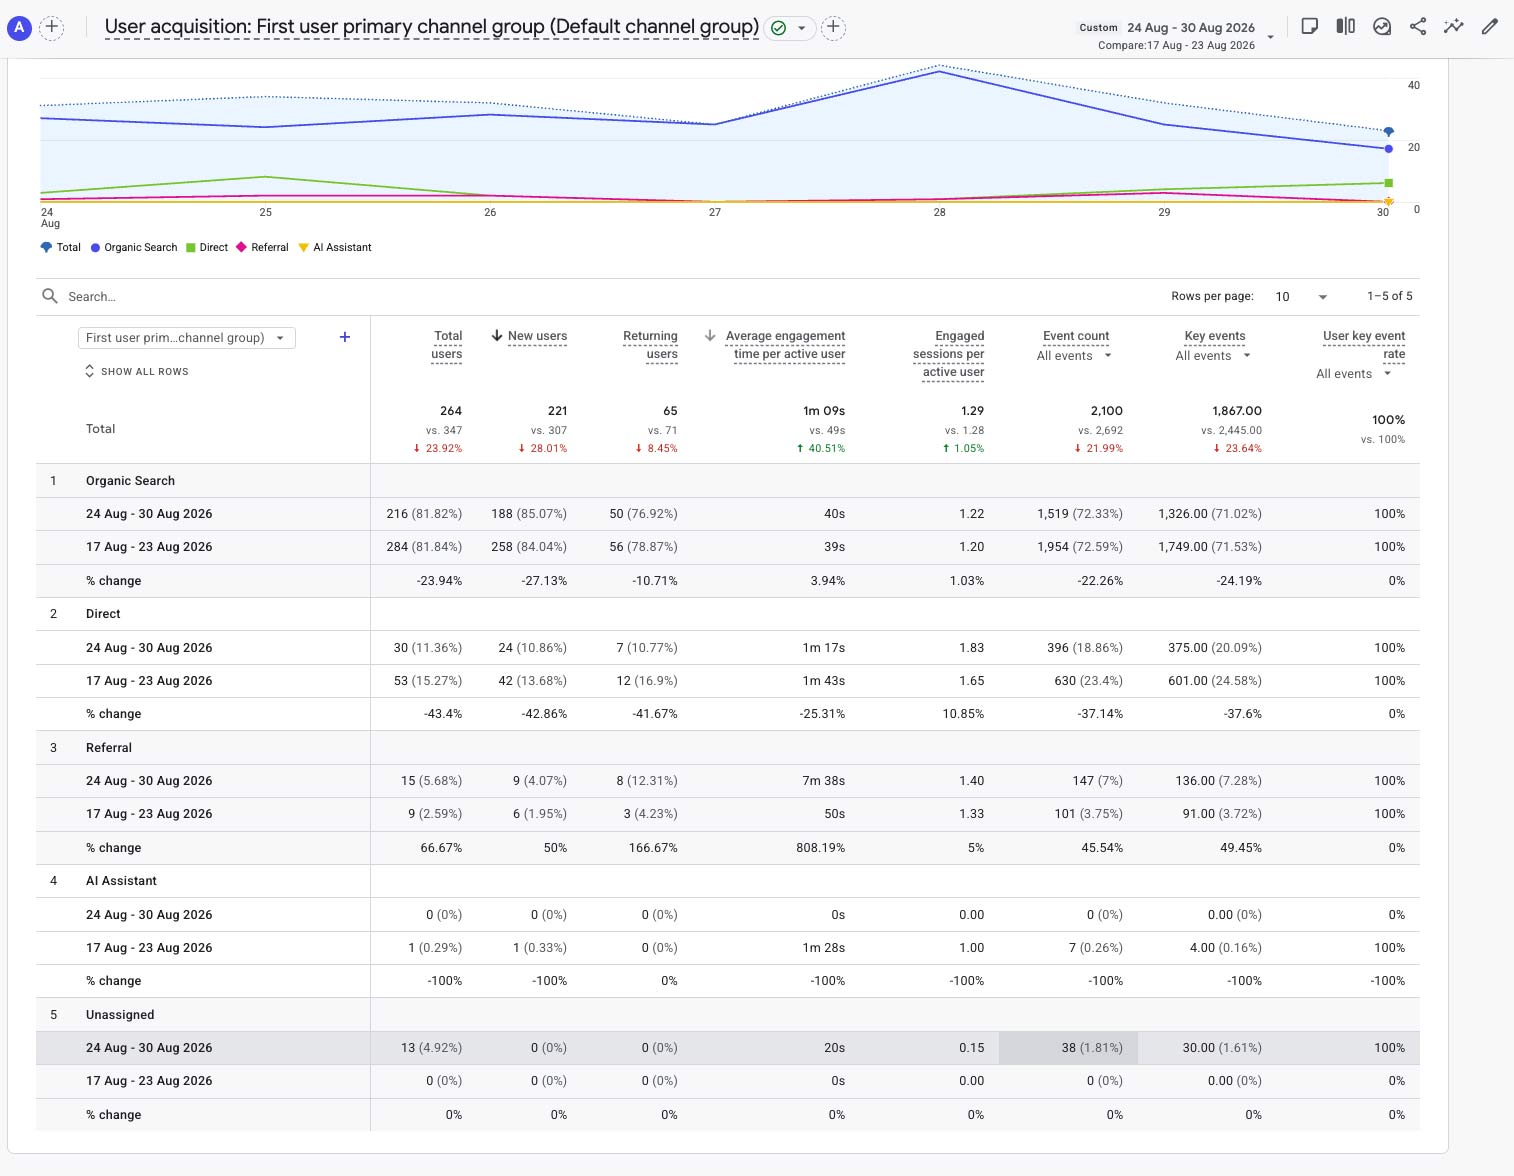
| Audience Quality | Stronger | Average engagement increased 40.5% to 1m 09s. |
| Customer Intent | Resilient | Click-to-Shop increased slightly despite 21.3% fewer sessions. |
| Referral | Emerging | Sessions more than doubled and engagement reached 4m 12s. |
| AI Acquisition | Monitor | 13 sessions, down 35.0%, but still a measurable source. |
Weekly Wins
- Average engagement increased to 1m 09s (+40.5%).
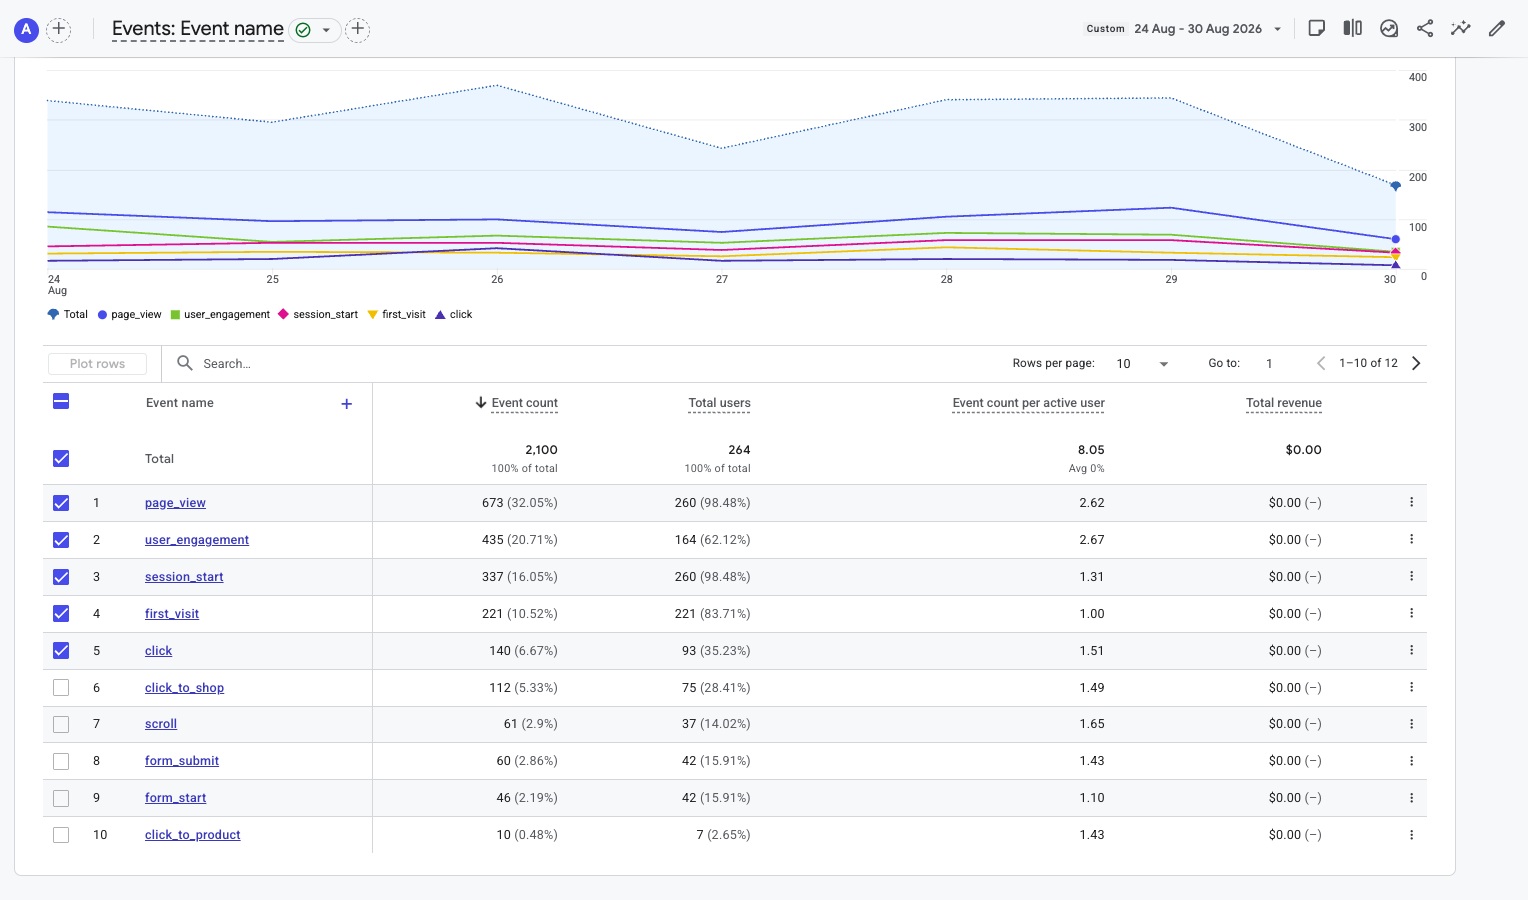
- Click-to-Shop reached 112 (+0.9%) despite materially lower traffic.
- Total clicks held at 140 (-1.4%).
- Referral increased to 27 sessions (+107.7%).
- Referral average engagement reached 4m 12s.
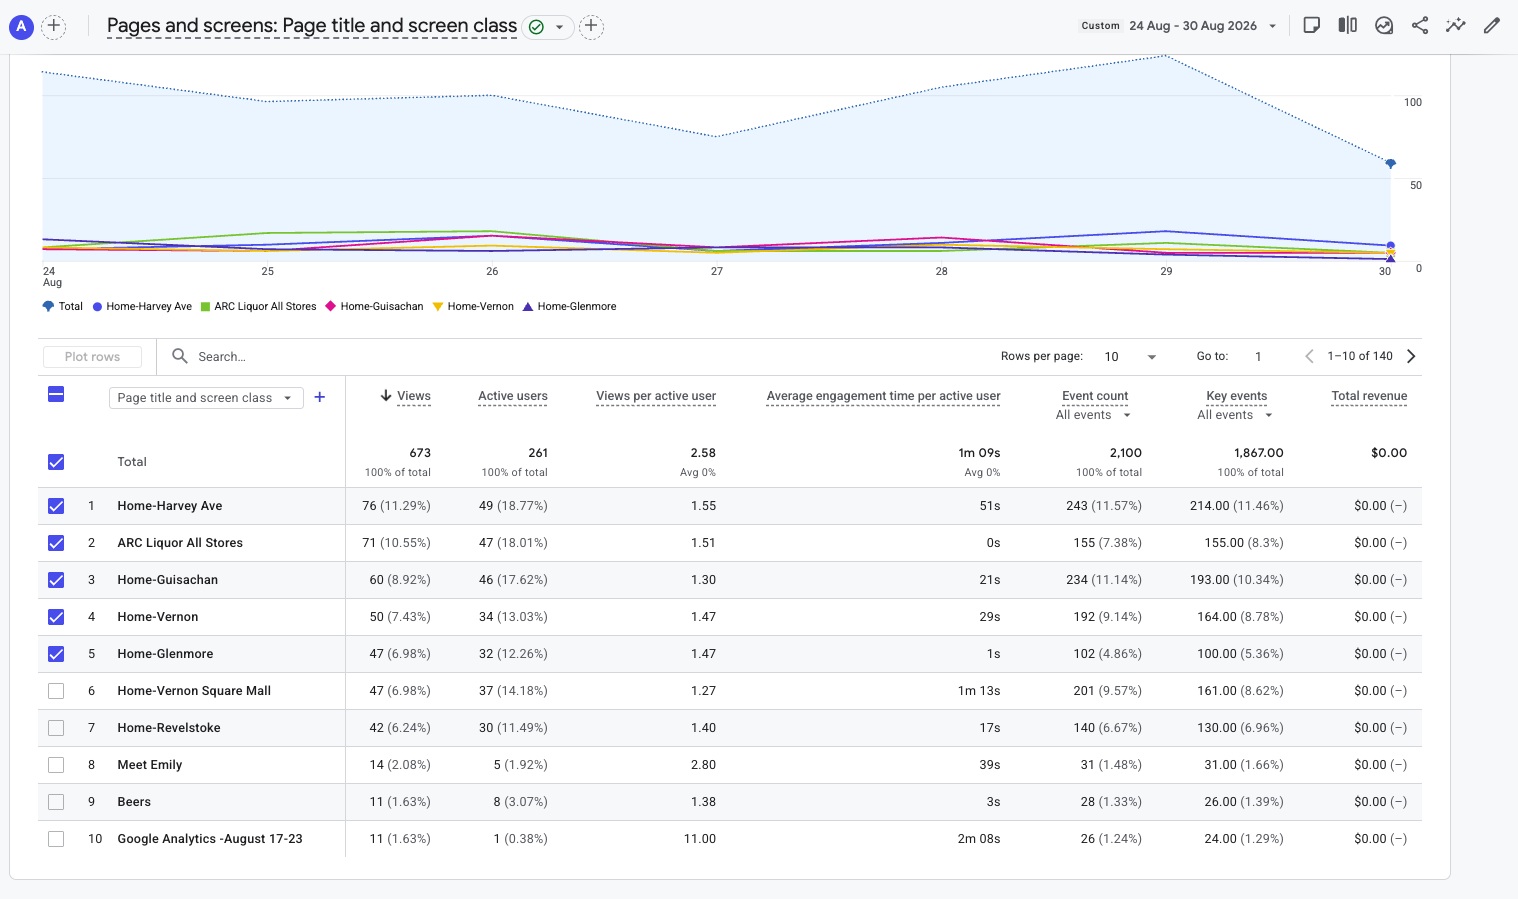
- Revelstoke views increased to 42 (+20.0%).
Watch List
- Organic Search fell 24.4% to 260 sessions.
- New users declined 28.0% to 221.
- Active users declined 23.7% to 261.
- AI Assistant sessions declined 35.0% to 13.
- 17 Unassigned sessions still require attribution review.
Week 24: Stronger Intent from a Smaller Audience
ARC generated 112 Click-to-Shop actions from 344 sessions, compared with 111 from 437 sessions in the previous GA4 comparison period. That lifts Click-to-Shop activity relative to sessions from approximately 25.4% to 32.6%.
Leadership interpretation: this is not a GA4 conversion-rate metric, but it is a useful directional efficiency measure. The commercial opportunity is to restore audience reach while preserving the stronger action density shown by Week 24 visitors.
Performance Overview
| Metric | This Week | Change |
|---|---|---|
| Active Users | 261 | -23.7% |
| New Users | 221 | -28.0% |
| Sessions | 344 | -21.3% |
| Page Views | 673 | -22.4% |
| Average Engagement Time | 1m 09s | +40.5% |
| Total Event Count | 2,100 | -22.0% |
| Key Events | 1,867 | -23.6% |
| Click-to-Shop | 112 | +0.9% |
Traffic Acquisition
| Channel | Sessions | Change | Leadership Read |
|---|---|---|---|
| Organic Search | 260 | -24.4% | Still dominant at 75.6%, but the main source of the weekly reach decline. |
| Direct | 37 | -37.3% | Lower than Week 23 and worth monitoring alongside Organic. |
| Referral | 27 | +107.7% | Small but highly engaged; source investigation recommended. |
| Unassigned | 17 | Review | Attribution cleanup remains required. |
| AI Assistant | 13 | -35.0% | Small-volume decline, still measurable in session acquisition. |
Store and Content Performance
| Page | Views |
|---|---|
| Home - Harvey Ave | 76 |
| ARC Liquor All Stores | 71 |
| Home - Guisachan | 60 |
| Home - Vernon | 50 |
| Home - Glenmore | 47 |
| Home - Vernon Square Mall | 47 |
| Home - Revelstoke | 42 |
| Meet Emily | 14 |
Interpretation
The store network broadly reflected the overall reduction in reach. Harvey remained ARC's leading store page, while Revelstoke stood out with a 20.0% increase. Meet Emily remained visible in the top ten and continues to serve as an early baseline for the developing wine-discovery experience.
Customer Intent
| Action | Week 24 | Change |
|---|---|---|
| Total Clicks | 140 | -1.4% |
| Click-to-Shop | 112 | +0.9% |
| Form Submissions | 60 | -10.4% |
| Form Starts | 46 | -8.0% |
| Click-to-Product | 10 | -33.3% |
What this means: most volume metrics softened with traffic, but customer action did not decline proportionally. The near-flat click total and slightly higher Click-to-Shop count are the strongest evidence that Week 24 visitors were more purposeful.
Search & Referral Signals
Organic Search remains ARC's primary acquisition source, but several branded and local search terms were lower this week. Referral moved in the opposite direction, increasing to 27 sessions and producing unusually high average engagement. The source mix should be reviewed to identify whether one or more referring sites are contributing meaningful customer traffic.
Recommended Actions
- Investigate the weekly decline in Organic Search and branded-query visibility.
- Preserve the stronger shopping efficiency while traffic recovers.
- Identify the sources behind the Referral increase and 4m 12s engagement.
- Continue monitoring Meet Emily as the wine-discovery baseline develops.
- Continue attribution cleanup for Unassigned traffic.
Trend Tracker
| Signal | Status | Leadership Read |
|---|---|---|
| Organic Search | Softened | 260 sessions, down 24.4%. |
| Audience Reach | Lower | Sessions and new users both declined materially. |
| Engagement Quality | Stronger | Average engagement increased 40.5%. |
| Shopping Intent | Resilient | Click-to-Shop held slightly above Week 23. |
| Referral | Emerging | 27 sessions, up 107.7%, with strong engagement. |
| Attribution | Review | 17 Unassigned sessions require continued investigation. |
Supporting GA4 Reports
These screenshots follow the approved descriptive naming convention for Week 24.