
ARC Liquor Stores
Weekly Reporting • GA4 + Intent Tracking
Weekly Performance Report
A weekly leadership snapshot covering traffic, engagement, store-page performance, acquisition channels and customer-intent actions across ARC's connected digital platform.
Alongside the established Gold Standard report, an enhanced leadership layout is available with a visual scorecard, trend tracker and expanded interpretation.
Leadership takeaway (Week 25)
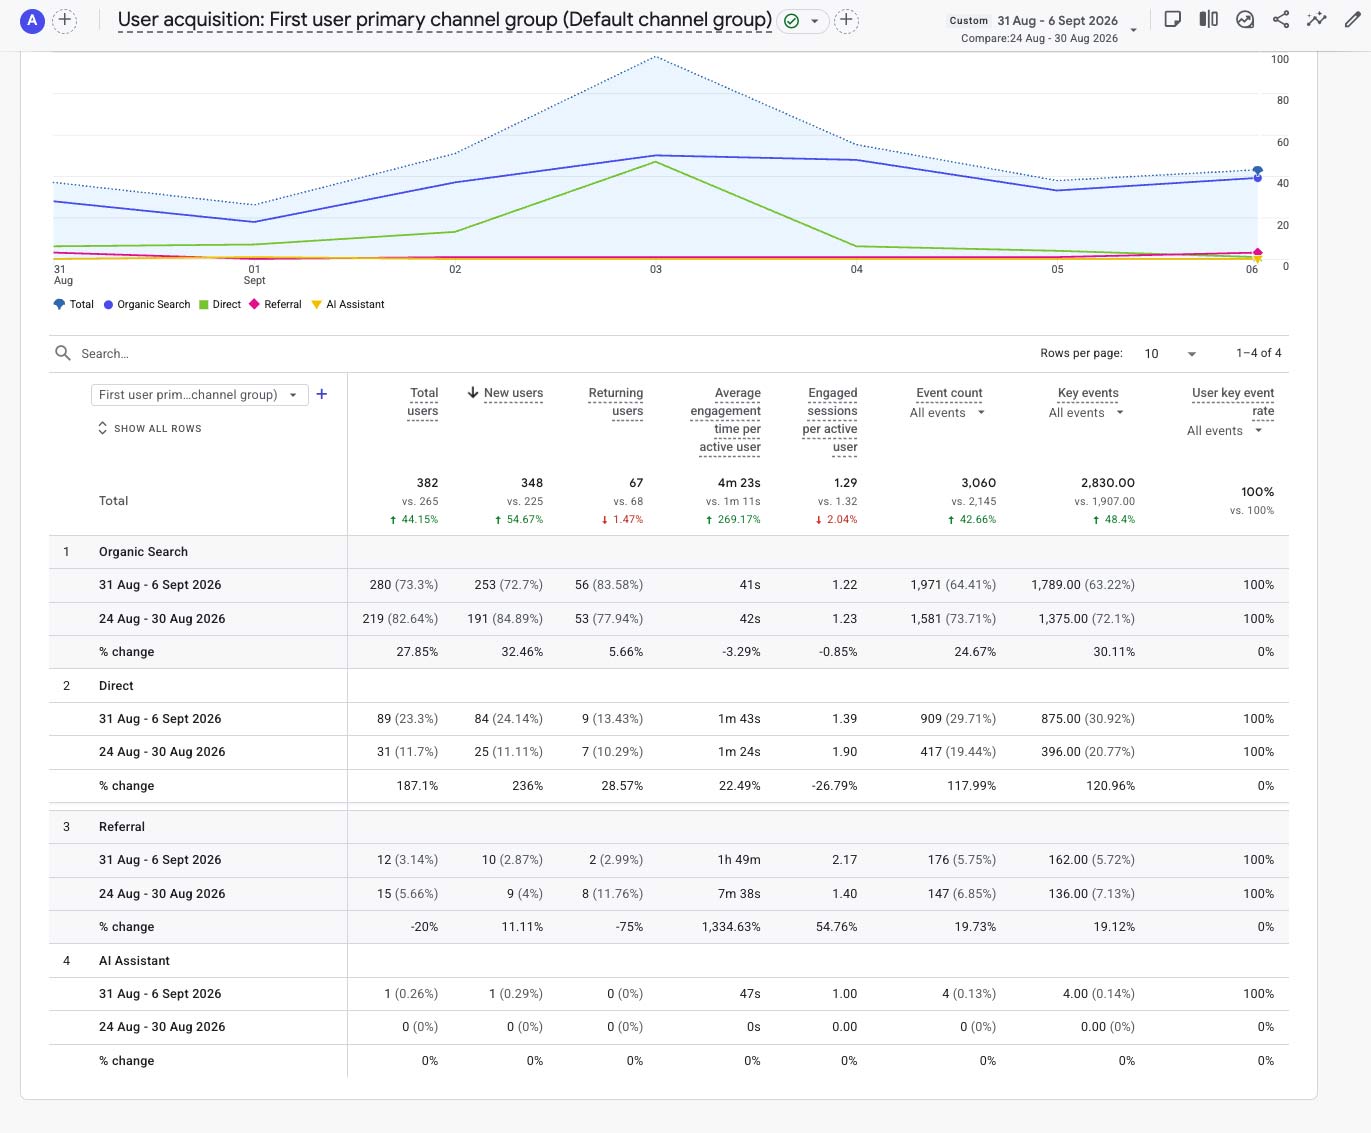
Week 25 delivered a decisive rebound across ARC's digital platform, with 490 sessions (▲41.2%), 489 engaged sessions (▲41.3%), 382 active users (▲44.2%) and 348 new users (▲54.7%). Organic Search also recovered strongly to 345 sessions (▲30.2%).
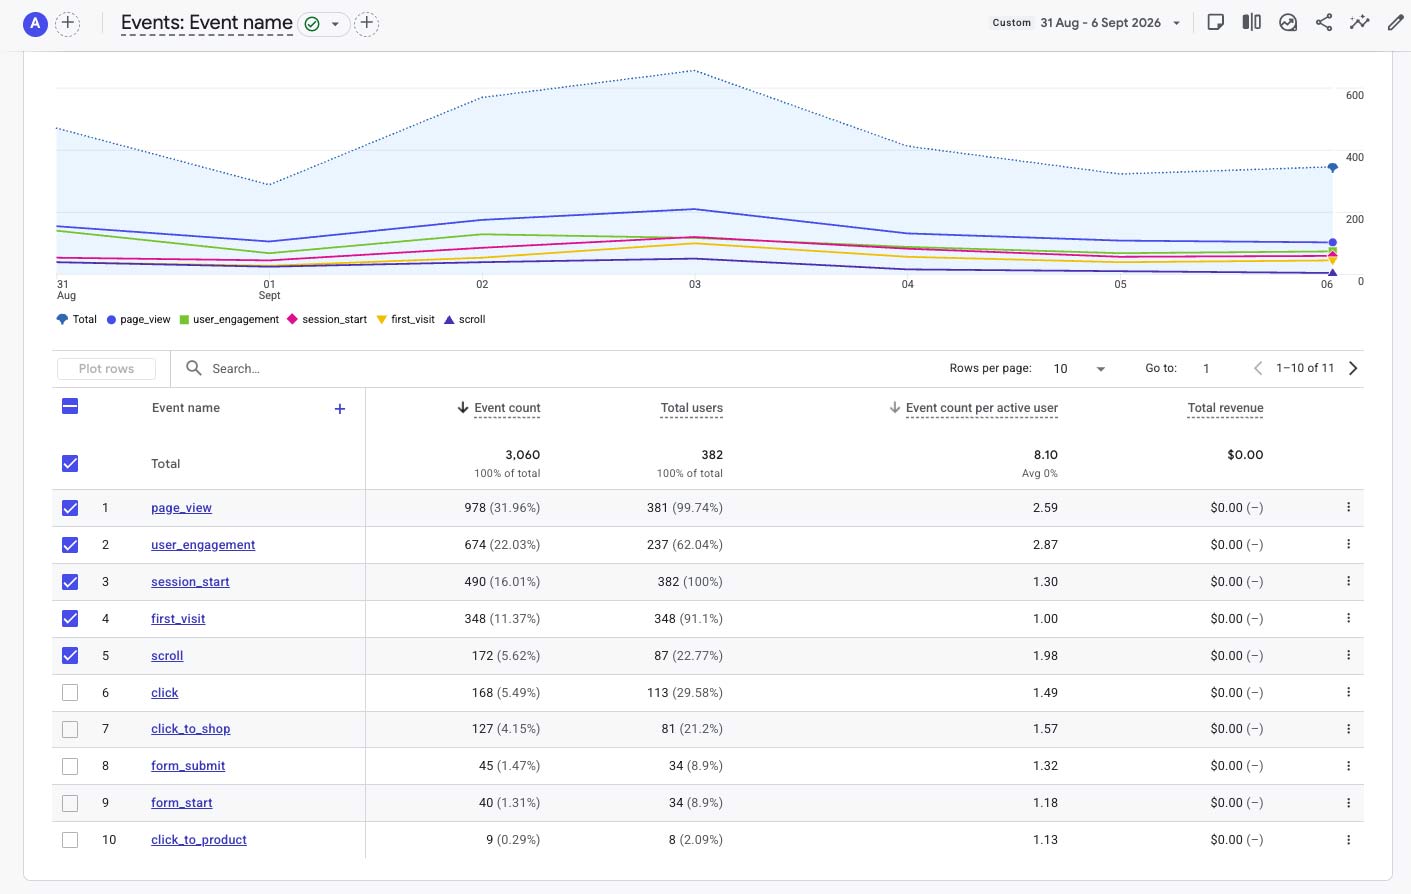
The standout result was engagement. Average engagement increased to 4m 23s (▲269.2%), while total events reached 3,060 (▲42.7%), key events reached 2,830 (▲48.4%), total clicks rose to 168 (▲20.0%) and Click-to-Shop increased to 127 (▲13.4%).
Week 24 showed that ARC could preserve customer intent despite a smaller audience. Week 25 added the missing ingredient: reach returned strongly, and the larger audience interacted much more deeply. ARC gained both scale and engagement quality in the same week.
Weekly wins
- Sessions: increased 41.2% to 490.
- New users: increased 54.7% to 348.
- Average engagement: increased 269.2% to 4m 23s.
- Organic Search: 345 sessions, up 30.2%.
- Direct traffic: 103 sessions, up 157.5%.
- AI Assistant: 21 sessions, up 61.5%, with 5m 22s average engagement.
- Harvey Avenue: 142 page views, a strong rebound from Week 24.
Watch list
- Referral: 19 sessions, down 32.1%.
- Form submissions: 45, down from 60.
- Form starts: 40, down from 46.
- Click-to-Product: 9, down slightly from 10.
- Emily pages: excellent engagement depth, but only three active users on each page means the sample remains small.
PDF report download
The PDF contains the complete Week 25 analysis, supporting GA4 screenshots, acquisition data, store-page performance, event tracking and recommended actions.
Sessions: 490 • Avg. Engagement: 4m 23s • Clicks: 168 • Click-to-Shop: 127| Metric | Week 25 | WoW change |
|---|---|---|
| Active users | 382 | ▲ 44.2% |
| New users | 348 | ▲ 54.7% |
| Sessions | 490 | ▲ 41.2% |
| Engaged sessions | 489 | ▲ 41.3% |
| Page views | 978 | ▲ 45.3% |
| Average engagement time | 4m 23s | ▲ 269.2% |
| Total events | 3,060 | ▲ 42.7% |
| Key events | 2,830 | ▲ 48.4% |
| Click-to-Shop | 127 | ▲ 13.4% |
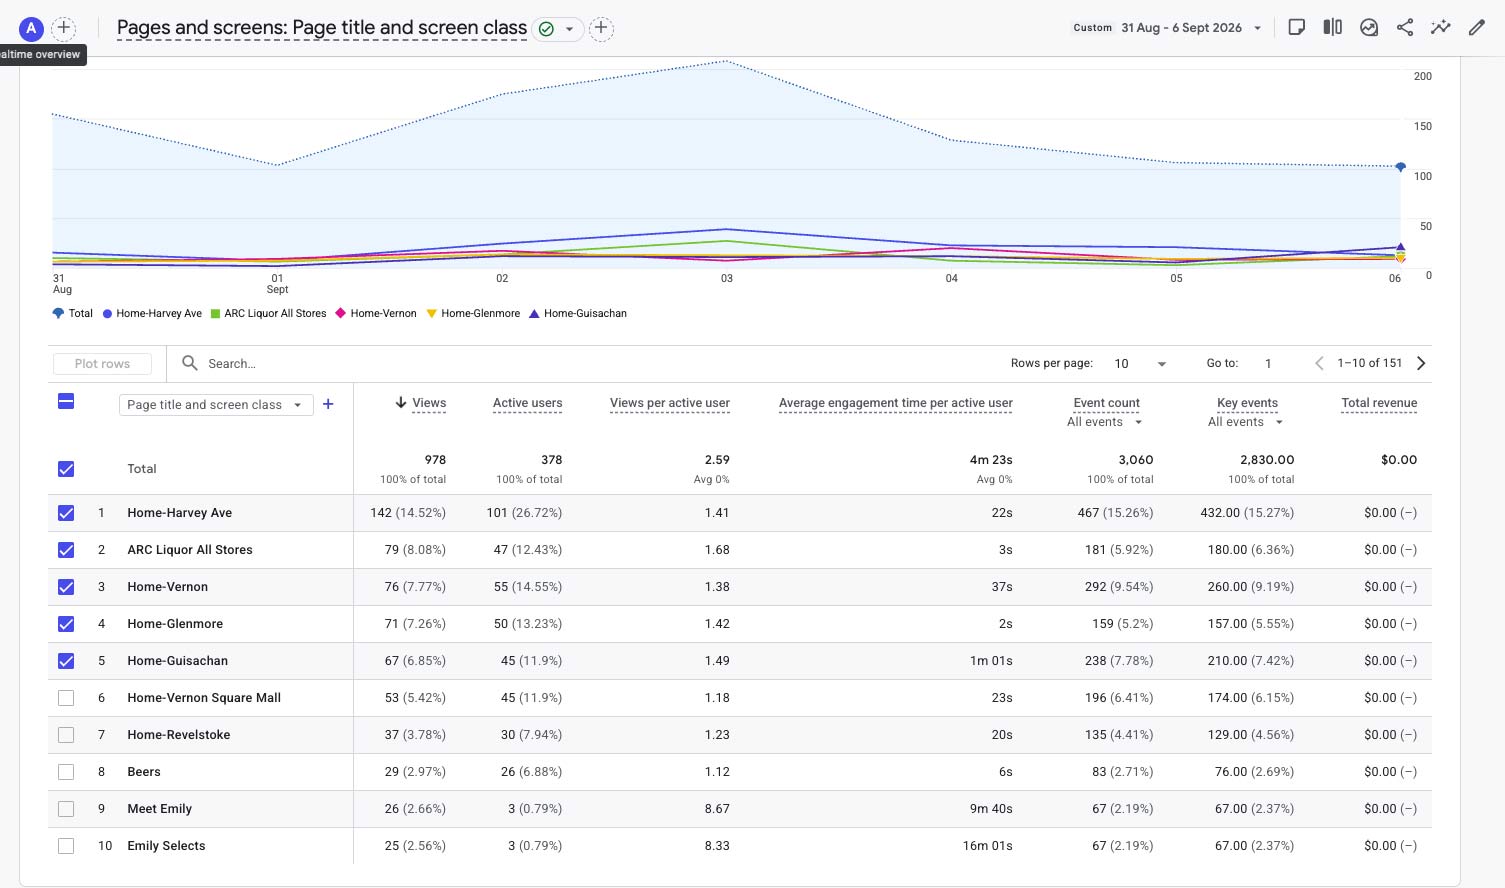
Store-page performance rebounded across most of the network. Harvey Avenue led ARC with 142 views, while Vernon and Glenmore also strengthened materially. Meet Emily and Emily Selects both entered the Top 10, providing a useful early signal for the expanding Emily customer journey.
| Page | Views | WoW note |
|---|---|---|
| Home-Harvey Ave | 142 | ▲ 86.8% |
| ARC Liquor All Stores | 79 | ▲ 11.3% |
| Home-Vernon | 76 | ▲ 52.0% |
| Home-Glenmore | 71 | ▲ 51.1% |
| Home-Guisachan | 67 | ▲ 11.7% |
| Home-Vernon Square Mall | 53 | ▲ 12.8% |
| Home-Revelstoke | 37 | ▼ 11.9% |
| Meet Emily | 26 | ▲ 85.7% |
| Emily Selects | 25 | Top 10 |
Meet Emily recorded 9m 40s average engagement and Emily Selects 16m 01s. Those are striking engagement times, but each page involved only three active users. These should therefore be treated as encouraging early-depth signals rather than broad customer-demand evidence.
| Channel | Sessions | WoW note |
|---|---|---|
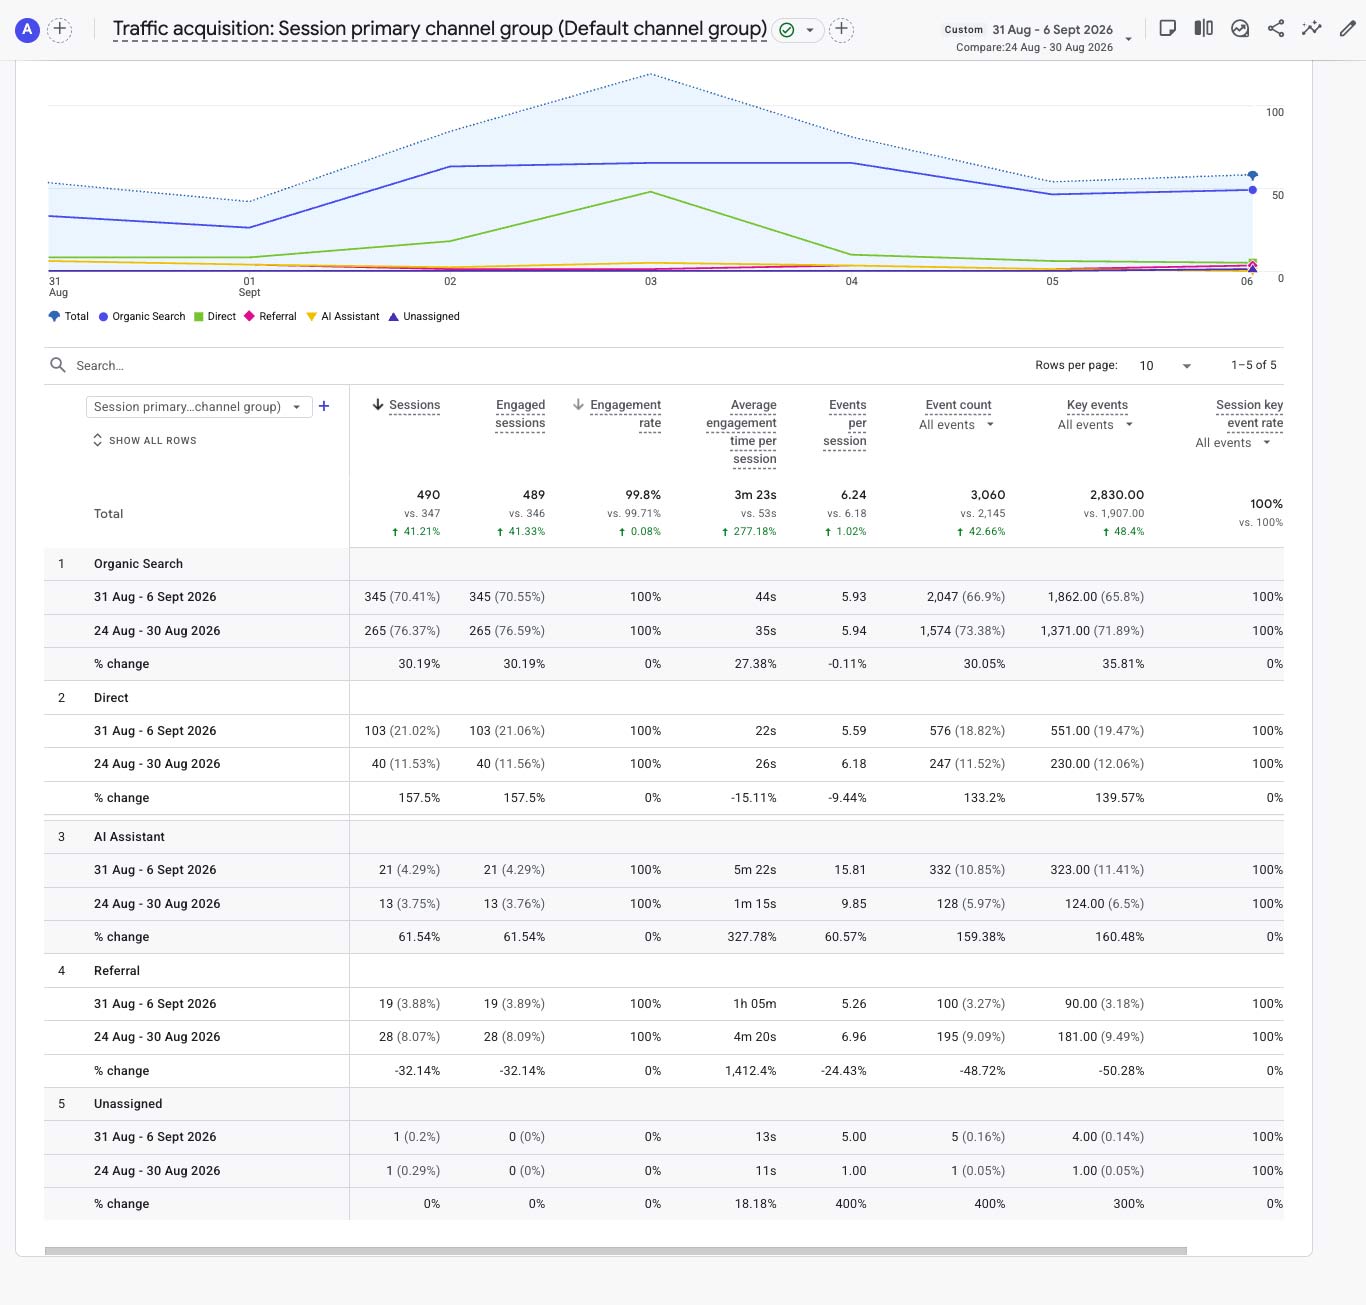
| Organic Search | 345 | ▲ 30.2% |
| Direct | 103 | ▲ 157.5% |
| AI Assistant | 21 | ▲ 61.5% |
| Referral | 19 | ▼ 32.1% |
| Unassigned | 1 | Minimal |
Organic Search recovered strongly and remains ARC's dominant source. Direct traffic more than doubled, while AI Assistant sessions rose to 21. The AI Assistant audience is still small, but its 5m 22s average engagement and 15.81 events per session make the quality signal increasingly interesting.
| Event | Week 25 | WoW change |
|---|---|---|
| page_view | 978 | ▲ 45.3% |
| user_engagement | 674 | ▲ 54.9% |
| session_start | 490 | ▲ 45.4% |
| first_visit | 348 | ▲ 57.5% |
| scroll | 172 | ▲ 182.0% |
| click | 168 | ▲ 20.0% |
| click_to_shop | 127 | ▲ 13.4% |
| form_submit | 45 | ▼ 25.0% |
| form_start | 40 | ▼ 13.0% |
| click_to_product | 9 | ▼ 10.0% |
The recovery extended well beyond traffic volume. Page views, user engagement, scrolling, clicks and Click-to-Shop all increased. Forms were the principal exception and deserve a focused review rather than being allowed to obscure the broader improvement in customer activity.
Click-to-Shop: 127 actions, up 13.4%. Click-to-Product: 9 actions, down 10.0%. Form submissions: 45, down 25.0%. Total clicks: 168, up 20.0%.
Week 25 combined renewed reach with stronger customer action. Click-to-Shop increased alongside sessions rather than being diluted by the larger audience, while total clicks also strengthened. ARC therefore gained scale without sacrificing commercial intent.
- Protect Organic Search momentum: identify the queries and landing pages behind the 30.2% recovery.
- Understand Direct growth: investigate the 157.5% increase and determine the contribution from bookmarks, campaigns and attribution.
- Monitor AI Assistant: continue tracking this small but increasingly high-engagement acquisition source.
- Measure Emily carefully: preserve a clean baseline and monitor customer movement from Emily content into products and shopping actions.
- Review forms: investigate why starts and submissions softened while broader engagement strengthened.
- Maintain attribution quality: Unassigned traffic is now minimal and should remain that way.
Week 25 was one of ARC's strongest recent digital weeks. Audience reach returned, Organic Search recovered, Direct traffic accelerated, engagement deepened dramatically and customer actions strengthened. The opportunity now is to understand which parts of this improvement are repeatable and convert that momentum into sustained customer growth.
Week 25 brought the audience back — and this time they stayed, explored and acted.
You can view the graphs and read the full analysis in the PDF report.
Click to download this reportGA4 Glossary (quick reference)
A quick guide to the core metrics used in this report.
Active users
Unique people who actively visited during the reporting window.
New users
First-time visitors in the reporting window.
Sessions
Total visits. One person can generate multiple sessions.
Engaged sessions
Sessions where the visitor showed meaningful engagement.
Event count
Total tracked interactions, including views, clicks, scrolls, forms and shopping actions.
Key events
Events marked as important in GA4 for conversion-style reporting.