Enhanced Leadership Performance Report
A leadership-focused interpretation of ARC's digital performance, customer intent, acquisition quality and emerging opportunities.
ARC Digital Scorecard
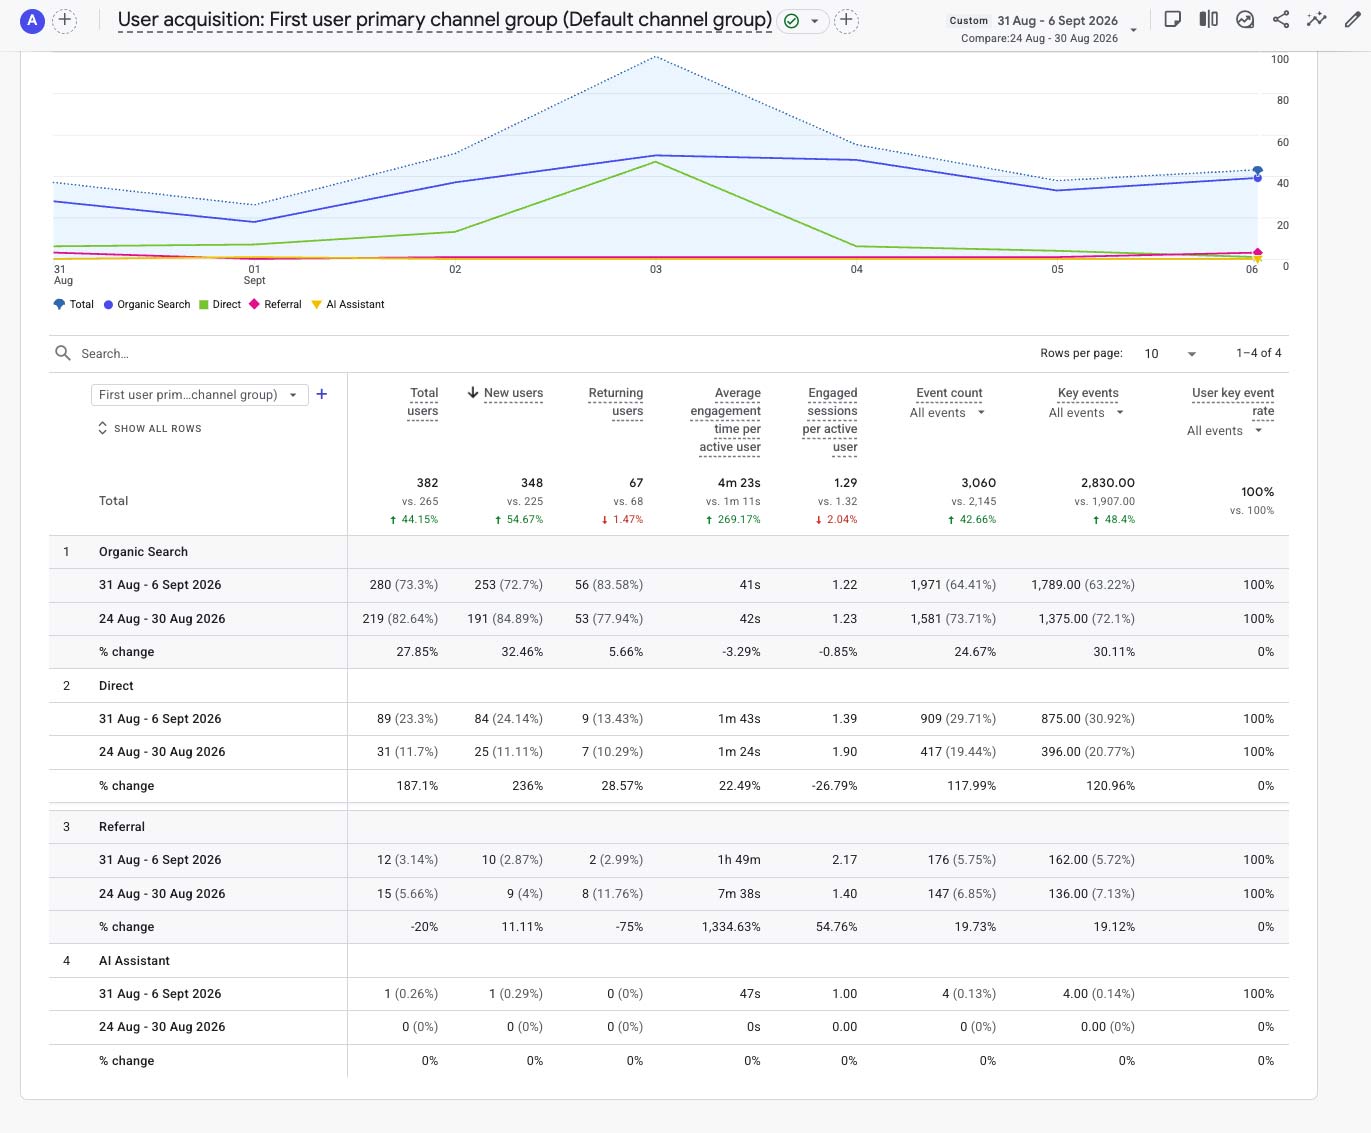
Week 25 combined renewed reach, exceptional engagement growth and stronger customer activity. The score is an analytical leadership summary rather than a native GA4 metric.
| Area | Status | Assessment |
|---|---|---|
| SEO Momentum | Recovered | Organic sessions increased 30.2% to 345. |
| Audience Quality | Exceptional | Average engagement increased 269.2% to 4m 23s. |
| Customer Intent | Stronger | Click-to-Shop increased 13.4% to 127 and total clicks rose 20.0%. |
| Direct Traffic | Surging | Sessions increased 157.5% to 103. |
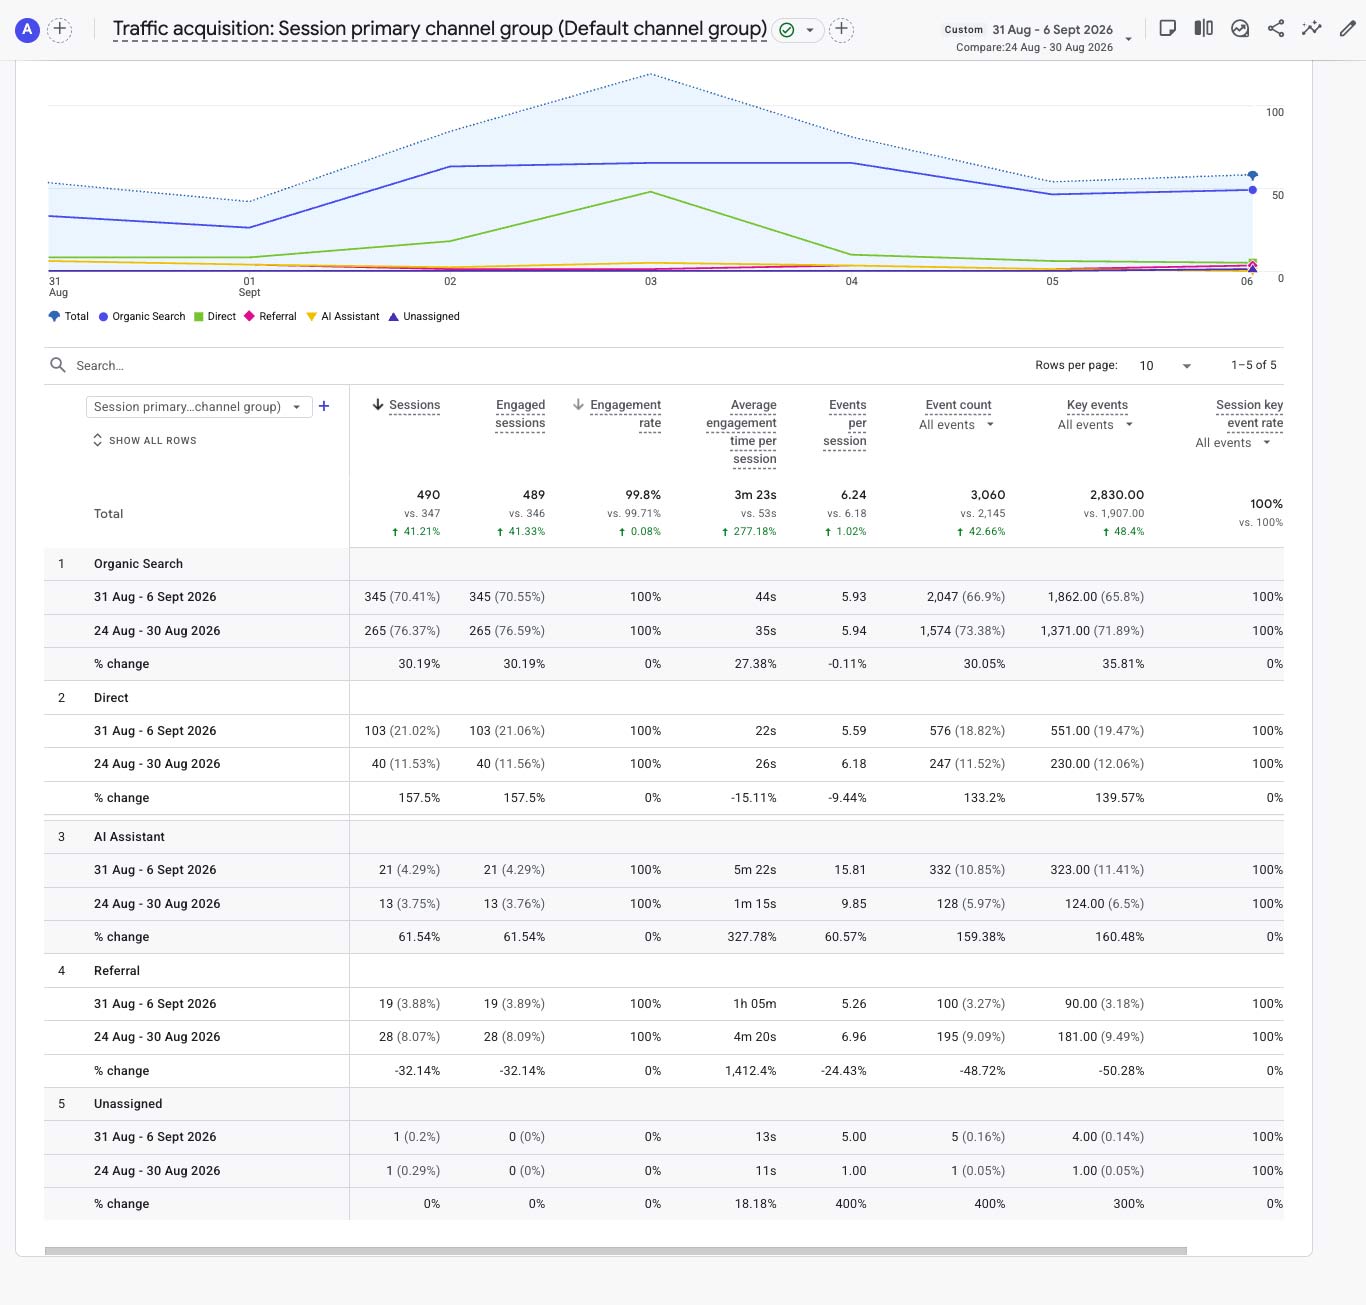
| AI Acquisition | Emerging | 21 sessions (+61.5%) with 5m 22s average engagement. |
Weekly Wins
- Sessions increased to 490 (+41.2%).
- Active users increased to 382 (+44.2%).
- New users increased to 348 (+54.7%).
- Average engagement reached 4m 23s (+269.2%).
- Organic Search increased to 345 sessions (+30.2%).
- Direct increased to 103 sessions (+157.5%).
- Click-to-Shop increased to 127 (+13.4%).
Watch List
- Referral sessions declined 32.1% to 19.
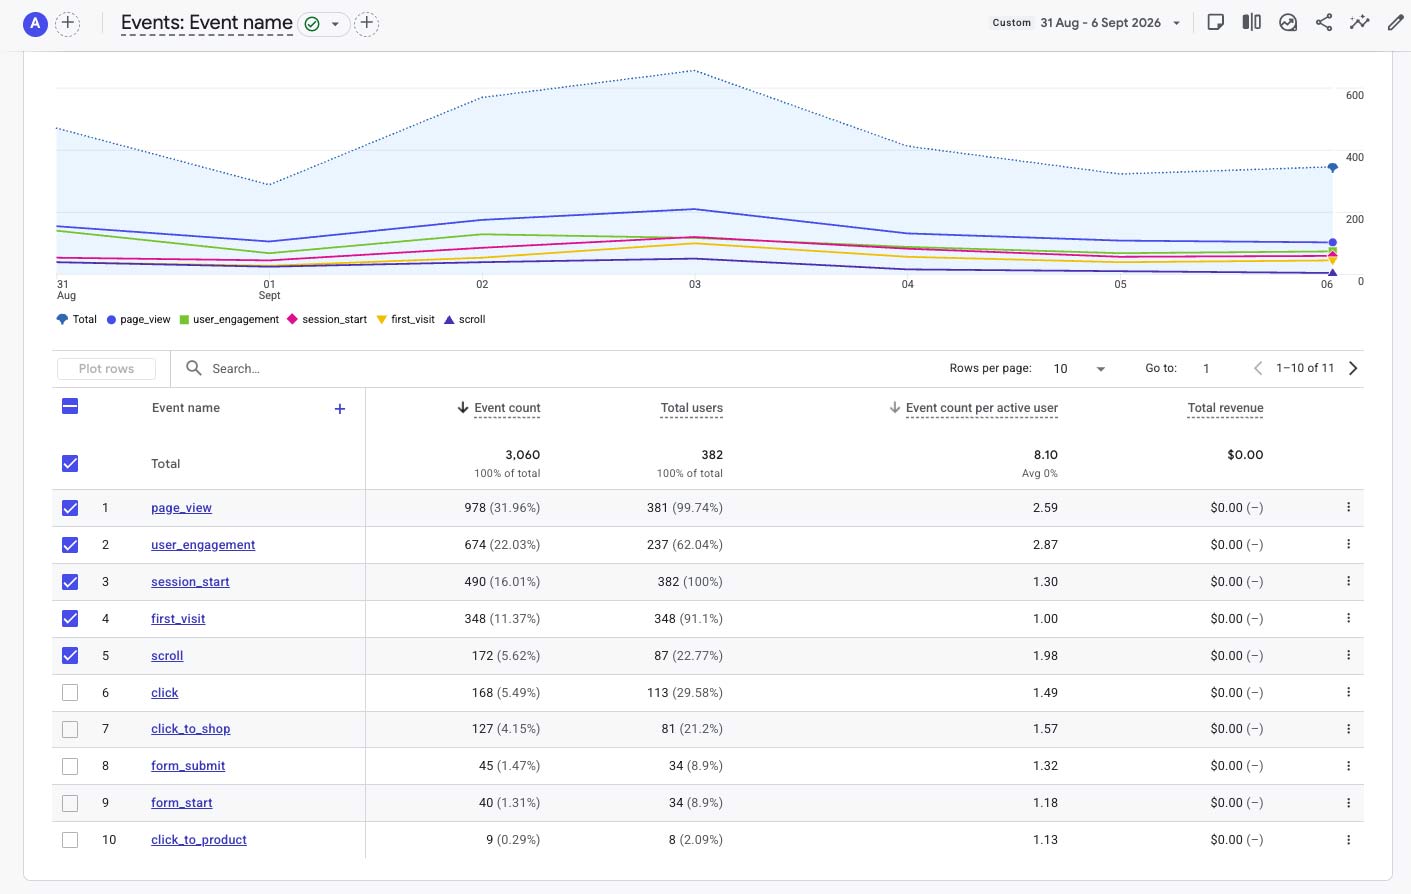
- Form submissions fell to 45 from 60.
- Form starts fell to 40 from 46.
- Click-to-Product eased to 9 from 10.
- Emily engagement is promising, but the current user sample remains small.
Week 25: Audience Scale Returned — Without Sacrificing Quality
Week 24 demonstrated unusually resilient customer intent despite a smaller audience. Week 25 added audience scale back into the equation: sessions increased to 490, average engagement reached 4m 23s, total clicks increased to 168 and Click-to-Shop reached 127.
Leadership interpretation: the important result is not simply that traffic recovered. ARC attracted substantially more visitors while engagement and customer actions also strengthened. The next objective is to identify which parts of this performance can be repeated consistently.
Performance Overview
| Metric | This Week | Change |
|---|---|---|
| Active Users | 382 | +44.2% |
| New Users | 348 | +54.7% |
| Sessions | 490 | +41.2% |
| Page Views | 978 | +45.3% |
| Average Engagement Time | 4m 23s | +269.2% |
| Total Event Count | 3,060 | +42.7% |
| Key Events | 2,830 | +48.4% |
| Click-to-Shop | 127 | +13.4% |
Traffic Acquisition
| Channel | Sessions | Change | Leadership Read |
|---|---|---|---|
| Organic Search | 345 | +30.2% | Strong recovery and still ARC's dominant acquisition source. |
| Direct | 103 | +157.5% | Exceptional weekly increase; source and attribution mix should be reviewed. |
| AI Assistant | 21 | +61.5% | Small volume but increasingly interesting quality, with 5m 22s average engagement. |
| Referral | 19 | -32.1% | Lower volume, although engagement remained unusually deep. |
| Unassigned | 1 | Minimal | Attribution issue is now materially reduced. |
Store and Content Performance
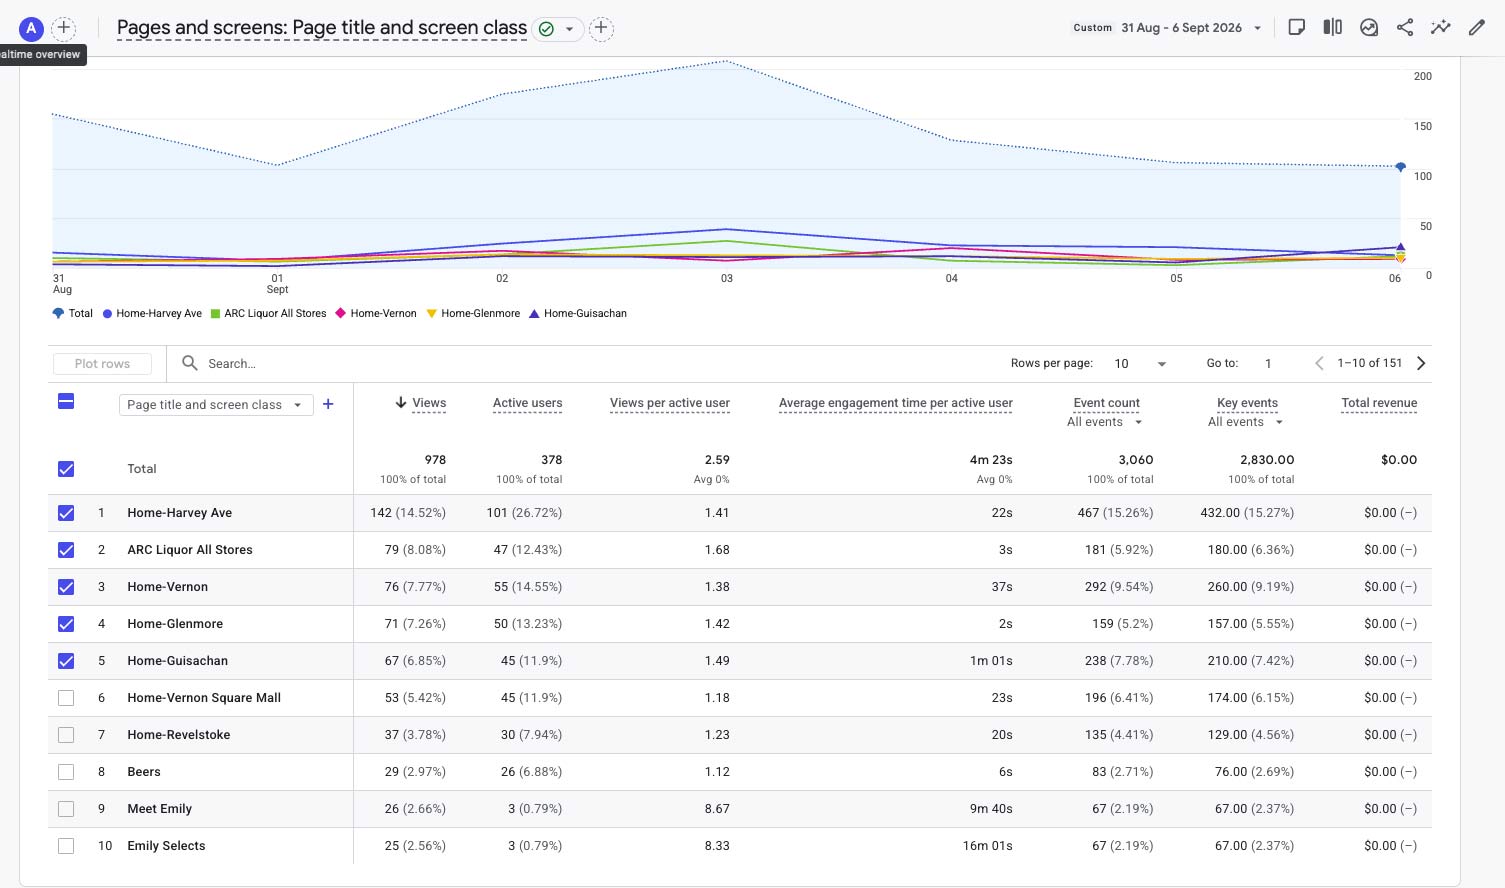
| Page | Views |
|---|---|
| Home - Harvey Ave | 142 |
| ARC Liquor All Stores | 79 |
| Home - Vernon | 76 |
| Home - Glenmore | 71 |
| Home - Guisachan | 67 |
| Home - Vernon Square Mall | 53 |
| Home - Revelstoke | 37 |
| Meet Emily | 26 |
| Emily Selects | 25 |
Interpretation
Harvey Avenue led the network with 142 views, while Vernon and Glenmore also rebounded strongly. Meet Emily and Emily Selects both entered the Top 10. Meet Emily recorded 9m 40s average engagement and Emily Selects 16m 01s, but each page involved only three active users, so these should be treated as encouraging early-depth signals rather than broad customer-demand evidence.
Customer Intent
| Action | Week 25 | Change |
|---|---|---|
| Total Clicks | 168 | +20.0% |
| Click-to-Shop | 127 | +13.4% |
| Form Submissions | 45 | -25.0% |
| Form Starts | 40 | -13.0% |
| Click-to-Product | 9 | -10.0% |
What this means: customer action broadly accelerated with the audience rebound. Clicks and Click-to-Shop both increased, showing that the return of traffic did not dilute commercial intent. Forms were the principal exception and deserve focused review.
Search & AI Signals
Organic Search recovered strongly to 345 sessions and remains ARC's primary acquisition engine. AI Assistant sessions increased to 21 and recorded 5m 22s average engagement with 15.81 events per session. The AI sample is still small, but the combination of growth and engagement quality makes it an increasingly useful signal to monitor.
Recommended Actions
- Identify the search queries and landing pages behind the Organic recovery.
- Investigate the source mix behind the 157.5% increase in Direct traffic.
- Continue monitoring AI Assistant acquisition and engagement quality.
- Preserve a clean measurement baseline for Meet Emily and Emily Selects.
- Investigate the decline in form starts and submissions.
- Maintain attribution quality now that Unassigned traffic is minimal.
Trend Tracker
| Signal | Status | Leadership Read |
|---|---|---|
| Organic Search | Recovered | 345 sessions, up 30.2%. |
| Audience Reach | Strong Growth | Sessions +41.2%, active users +44.2%, new users +54.7%. |
| Engagement Quality | Exceptional | Average engagement reached 4m 23s, up 269.2%. |
| Shopping Intent | Stronger | Click-to-Shop increased 13.4% to 127. |
| AI Assistant | Emerging | 21 sessions, up 61.5%, with strong engagement depth. |
| Forms | Review | Submissions and starts softened despite broader growth. |
Supporting GA4 Reports
These screenshots follow the approved descriptive naming convention for Week 25.