
ARC Liquor Stores
Weekly Reporting • GA4 + Intent Tracking
Weekly Performance Report
A weekly leadership snapshot covering traffic, engagement, store-page performance, acquisition channels and customer-intent actions across ARC's connected digital platform.
Alongside the established Gold Standard report, an enhanced leadership layout is available with a visual scorecard, trend tracker and expanded interpretation of the week's results.
Leadership takeaway (Week 21)
ARC recorded 463 sessions and 458 engaged sessions. Reach softened, with active users at 333 and new users at 298, but the customers who arrived interacted substantially more deeply: page views rose to 1,201 (+25.8%), user engagement events reached 905 (+44.1%), and total events increased to 3,398 (+14.1%).
The acquisition mix also broadened. Organic Search remained the largest channel at 307 sessions, while Direct more than doubled to 97. AI Assistant produced 27 sessions with unusually deep engagement, including 16m 05s average engagement time and 933 events; this remains a small sample and should be treated as an encouraging signal rather than a mature trend.
Week 21 attracted fewer individual visitors, but those visitors generated more page views, more engagement events and more total tracked activity. The quality and depth of the visit improved even while top-of-funnel reach softened.
Weekly wins
- Engagement depth: average engagement time increased 98.2% to 2m 09s.
- Page exploration: page views increased 25.8% to 1,201.
- User engagement: 905 events, up 44.1%.
- Direct traffic: 97 sessions, up 110.9%.
- AI Assistant: 27 sessions with 933 events and 16m 05s average engagement time.
- Scroll activity: increased 94.3% to 136.
Watch list
- Reach: active users declined 12.8% and new users declined 12.1%.
- Organic Search: sessions declined 24.0% to 307.
- Commercial intent: Click-to-Shop declined 8.7% to 136.
- Forms: submissions fell 41.2% and starts fell 40.0%.
- Attribution: 32 Unassigned sessions require review.
PDF report download
The PDF contains the complete Week 21 analysis, supporting GA4 screenshots, acquisition data, event tracking and recommended actions.
Sessions: 463 • Engaged Sessions: 458 • Events: 3,398 • Page Views: 1,201Avg. Engagement: 2m 09s • User Engagement: 905 • Scroll: 136| Metric | Week 21 | Previous week | WoW change |
|---|---|---|---|
| Active users | 333 | 382 | -12.8% |
| New users | 298 | 339 | -12.1% |
| Sessions | 463 | 496 | -6.7% |
| Engaged sessions | 458 | 494 | -7.3% |
| Pages and screen views | 1,201 | 955 | +25.8% |
| Average engagement time | 2m 09s | 1m 05s | +98.2% |
| Total event count | 3,398 | 2,978 | +14.1% |
| Click-to-Shop | 136 | 149 | -8.7% |
Harvey strengthened and remained the leading store homepage. The ARC Liquor All Stores gateway also edged higher, while Revelstoke improved. Vernon, Guisachan, Vernon Square Mall and Glenmore were softer week over week.
| Page | Views | WoW note |
|---|---|---|
| Home-Harvey Ave | 157 | +23.6% |
| ARC Liquor All Stores | 84 | +1.2% |
| Home-Vernon | 72 | -23.4% |
| Home-Guisachan | 68 | -18.1% |
| Home-Vernon Square Mall | 55 | -24.7% |
| Home-Revelstoke | 49 | +11.4% |
| Home-Glenmore | 36 | -46.3% |
Performance is mixed at store level rather than uniformly weaker. Harvey and Revelstoke gained visibility, and the All Stores gateway remained stable, while several other location pages need continued monitoring.
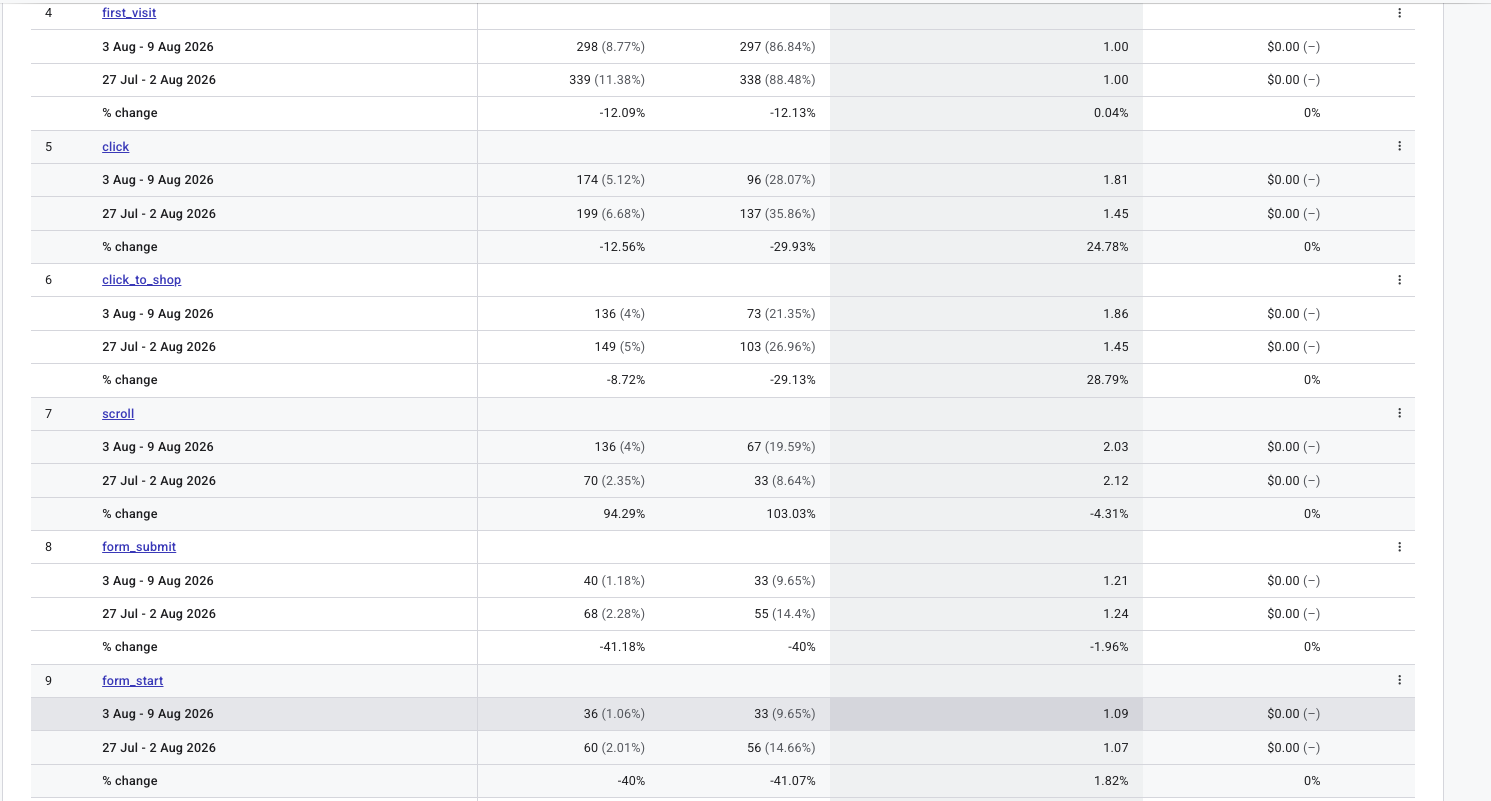
Sessions by primary channel
| Channel | Sessions | Share | Change |
|---|---|---|---|
| Organic Search | 307 | 66.3% | -24.0% |
| Direct | 97 | 21.0% | +110.9% |
| AI Assistant | 27 | 5.8% | +17.4% |
| Referral | 27 | 5.8% | +28.6% |
| Unassigned | 32 | 6.9% | Attribution review |
Organic Search remains the foundation, but Week 21 shows a healthier spread of supporting channels. Direct traffic more than doubled, Referral improved, and AI Assistant continued to produce measurable visits.
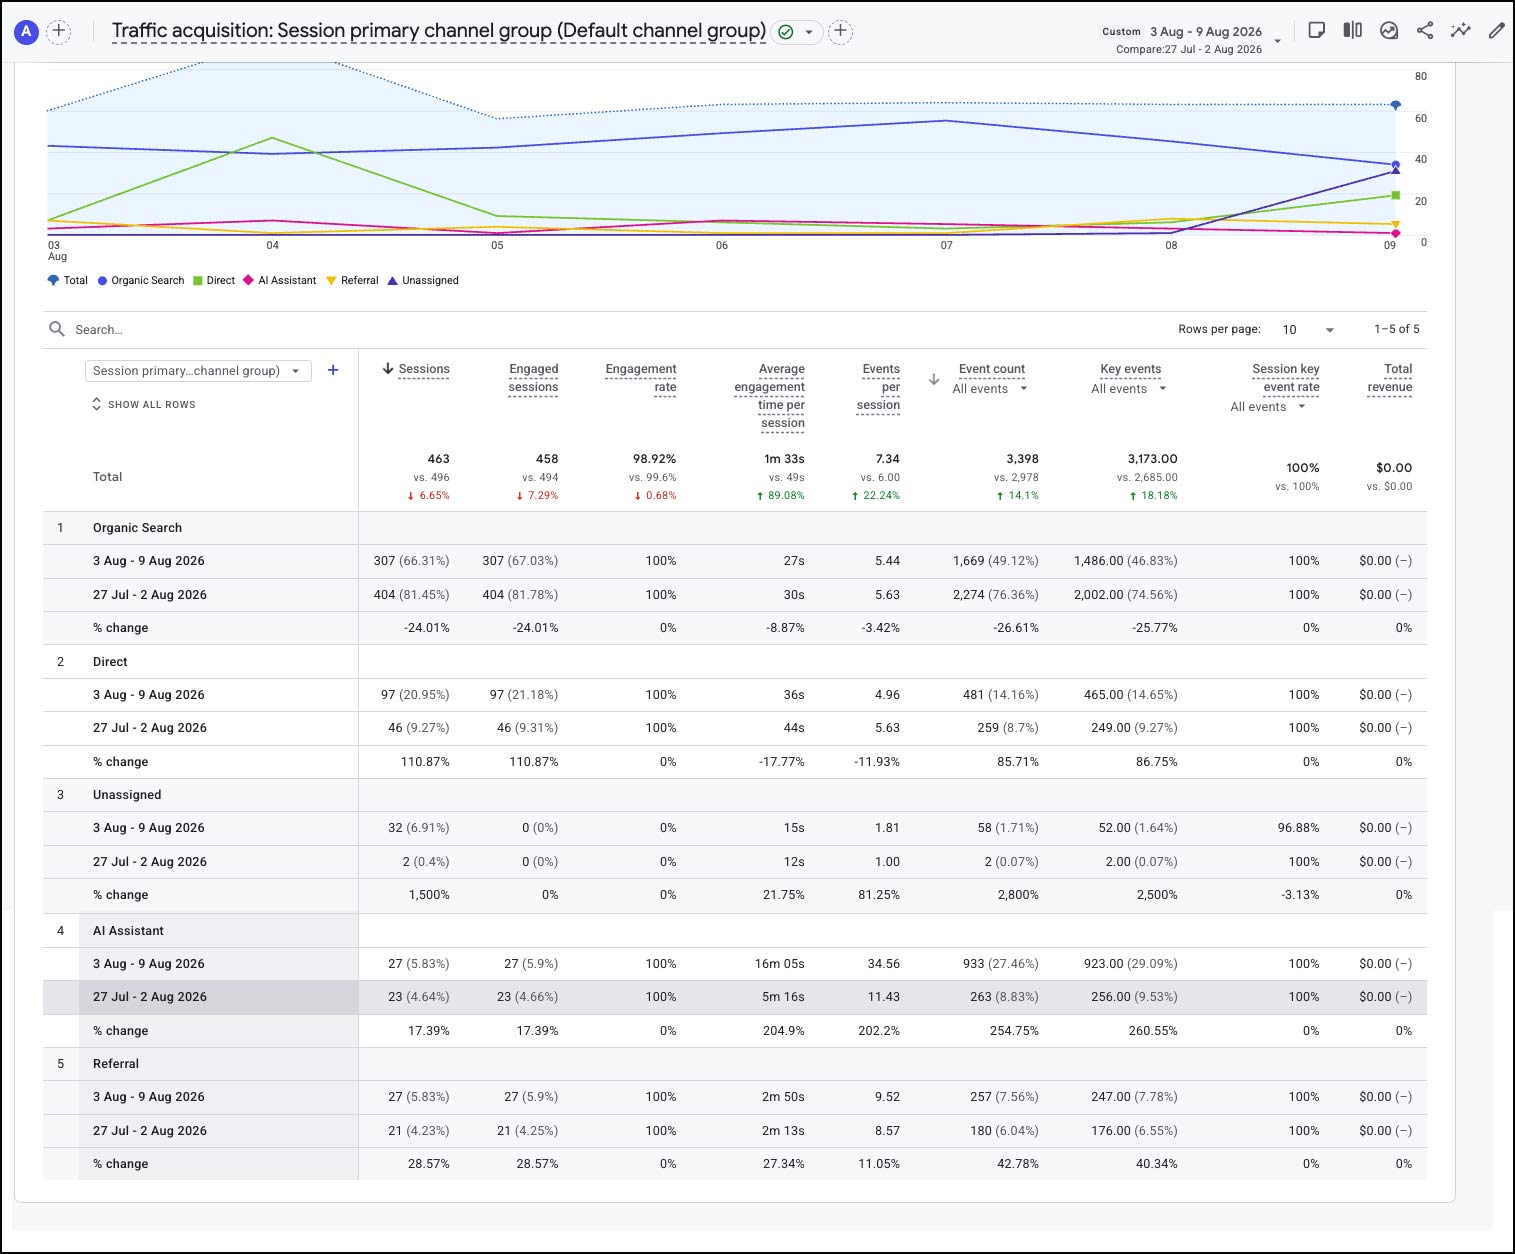
| Event | Week 21 | WoW change |
|---|---|---|
| page_view | 1,201 | +25.8% |
| user_engagement | 905 | +44.1% |
| session_start | 459 | -7.1% |
| first_visit | 298 | -12.1% |
| click | 174 | -12.6% |
| click_to_shop | 136 | -8.7% |
| scroll | 136 | +94.3% |
| form_submit | 40 | -41.2% |
| form_start | 36 | -40.0% |
| click_to_product | 10 | 0.0% |
The event mix is stronger than the user totals alone suggest. Customers generated more page views, more engagement and almost twice as many scroll events, while form activity and shopping clicks softened.
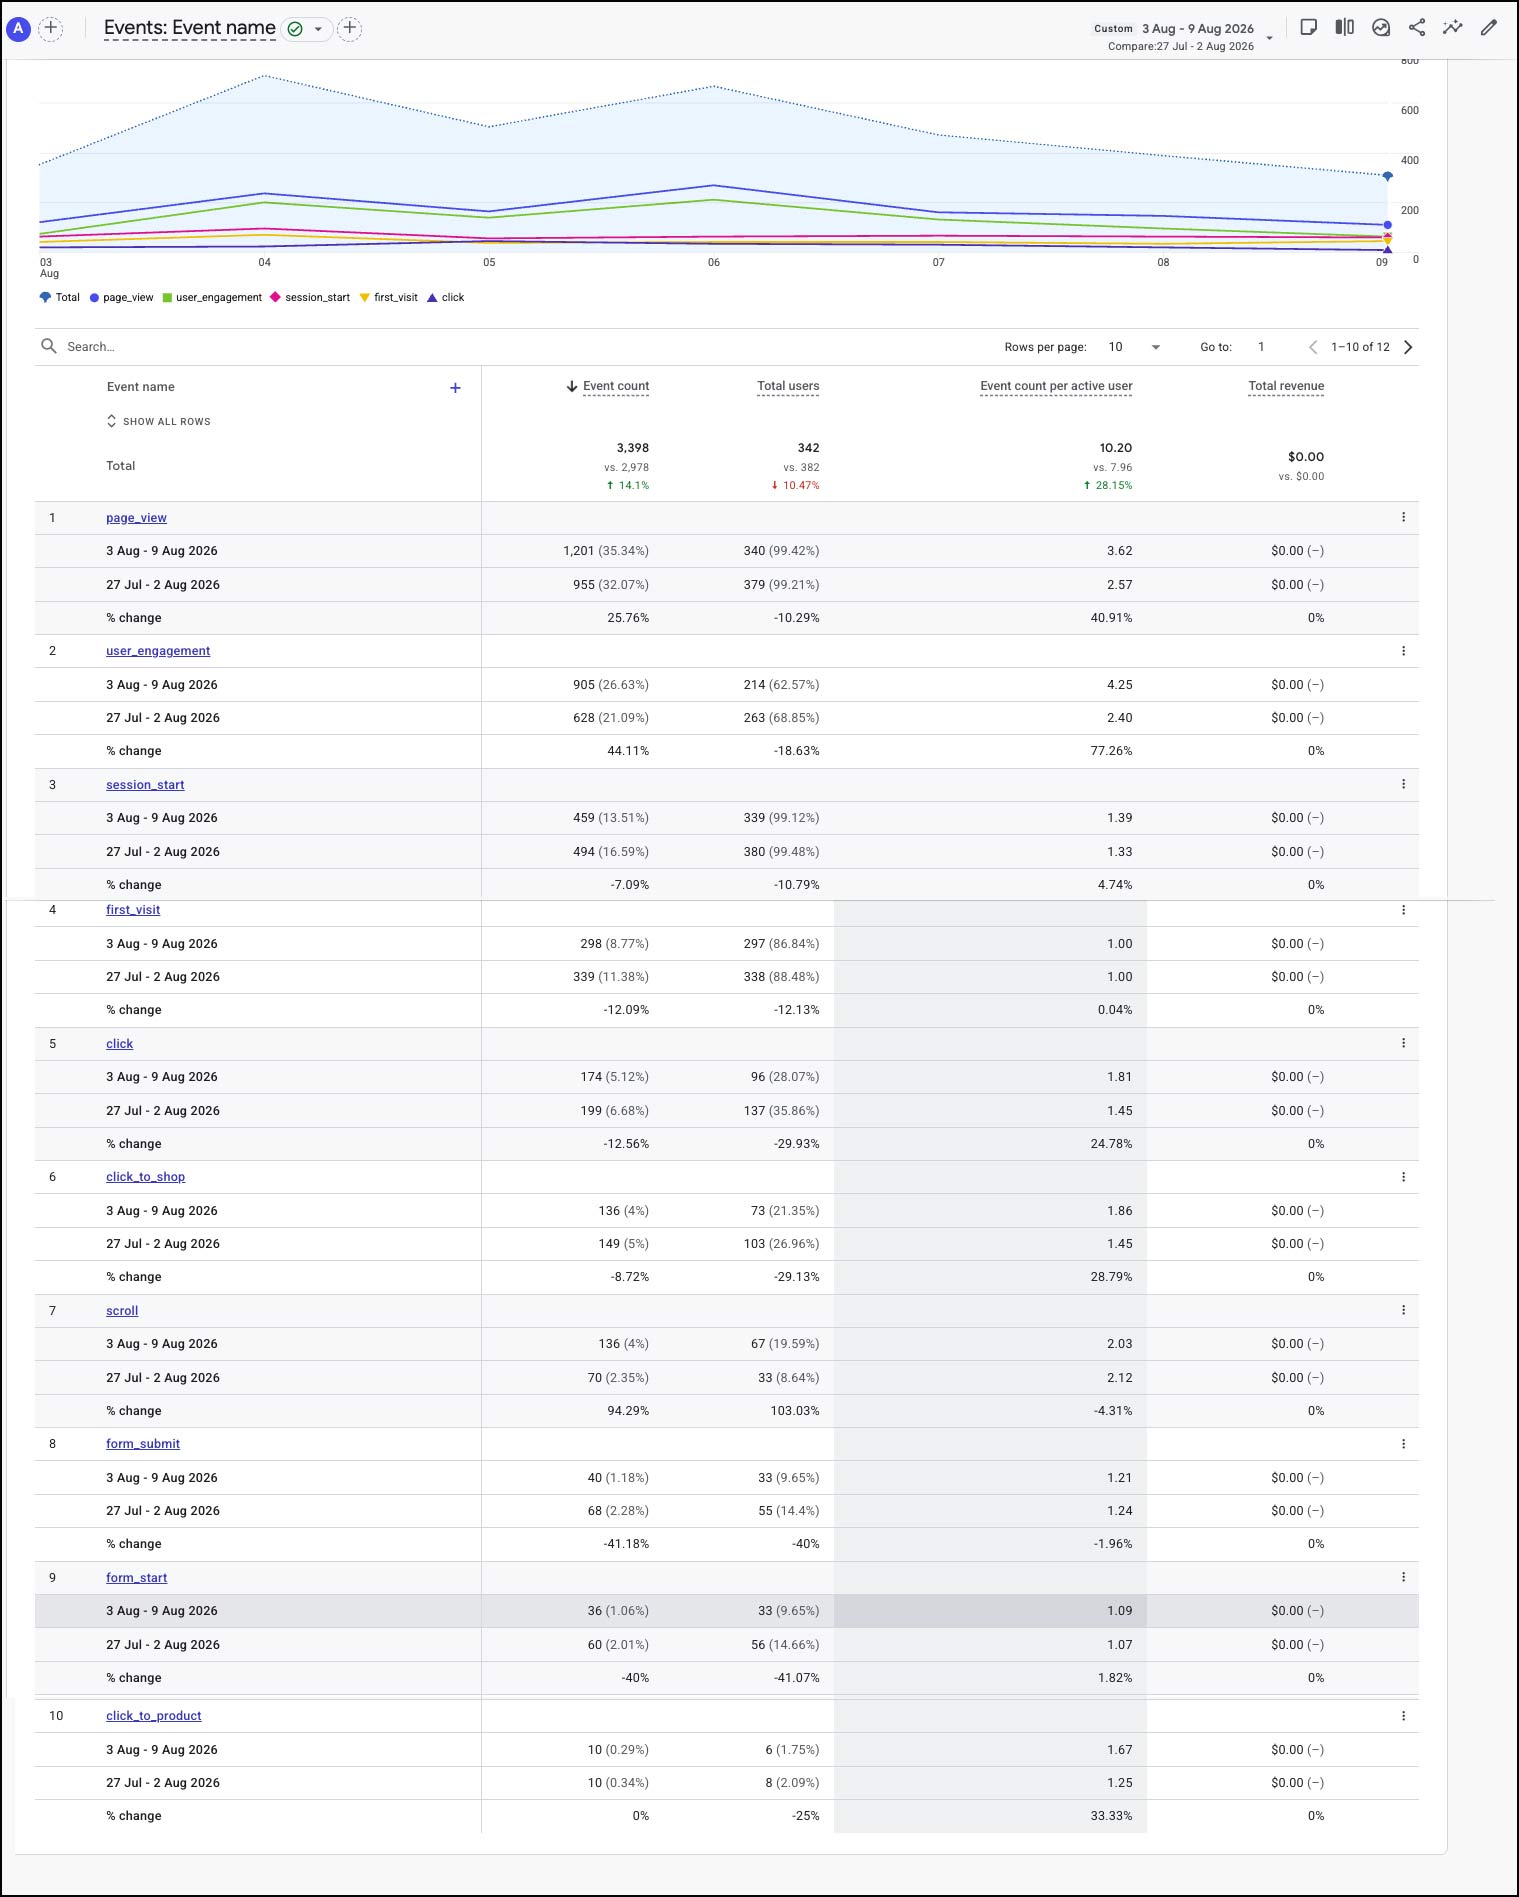
Click-to-Shop: 136 actions, down 8.7%. Click-to-Product: 10 actions, unchanged in event count, with event count per active user up 33.3%. Form submissions: 40, down 41.2%.
Commercial-intent actions did not keep pace with the improvement in content engagement. Week 21 therefore shows stronger exploration and attention, but a softer hand-off into shopping and enquiry actions.
- Protect Organic Search: review the 24.0% weekly decline while continuing store-level SEO and content development.
- Study Direct growth: determine whether the 110.9% increase reflects repeat visitors, offline awareness, bookmarks or campaign activity.
- Track AI Assistant quality: continue measuring sessions, engagement and downstream actions without over-interpreting the small sample.
- Improve conversion paths: review CTAs around high-engagement pages because shopping and form actions softened.
- Review Unassigned attribution: validate UTM tagging across GBP, Product Finders, QR codes, AI experiences and outbound links.
Week 21 was a quality-over-quantity week. ARC reached fewer users, but visitors viewed more pages, generated more engagement events and spent substantially longer interacting with the site. Direct, Referral and AI Assistant channels all strengthened, while Organic Search, forms and Click-to-Shop require attention. The overall direction remains positive because engagement depth improved materially despite softer reach.
Fewer visitors, deeper journeys: Week 21 showed that ARC's digital experience is giving customers more reasons to explore.
You can view the graphs and read the full analysis in the PDF report.
Click to download this reportGA4 Glossary (quick reference)
A quick guide to the core metrics used in this report.
Active users
Unique people who actively visited during the reporting window.
New users
First-time visitors in the reporting window.
Sessions
Total visits. One person can generate multiple sessions.
Engaged sessions
Sessions where the visitor showed meaningful engagement.
Event count
Total tracked interactions, including views, clicks, scrolls, forms and shopping actions.
Key events
Events marked as important in GA4 for conversion-style reporting.