Week 18: Website Performance
ARC Digital Scorecard
Overall website health is strong. This is an analytical summary rather than a native GA4 metric.
| Area | Status | Assessment |
|---|---|---|
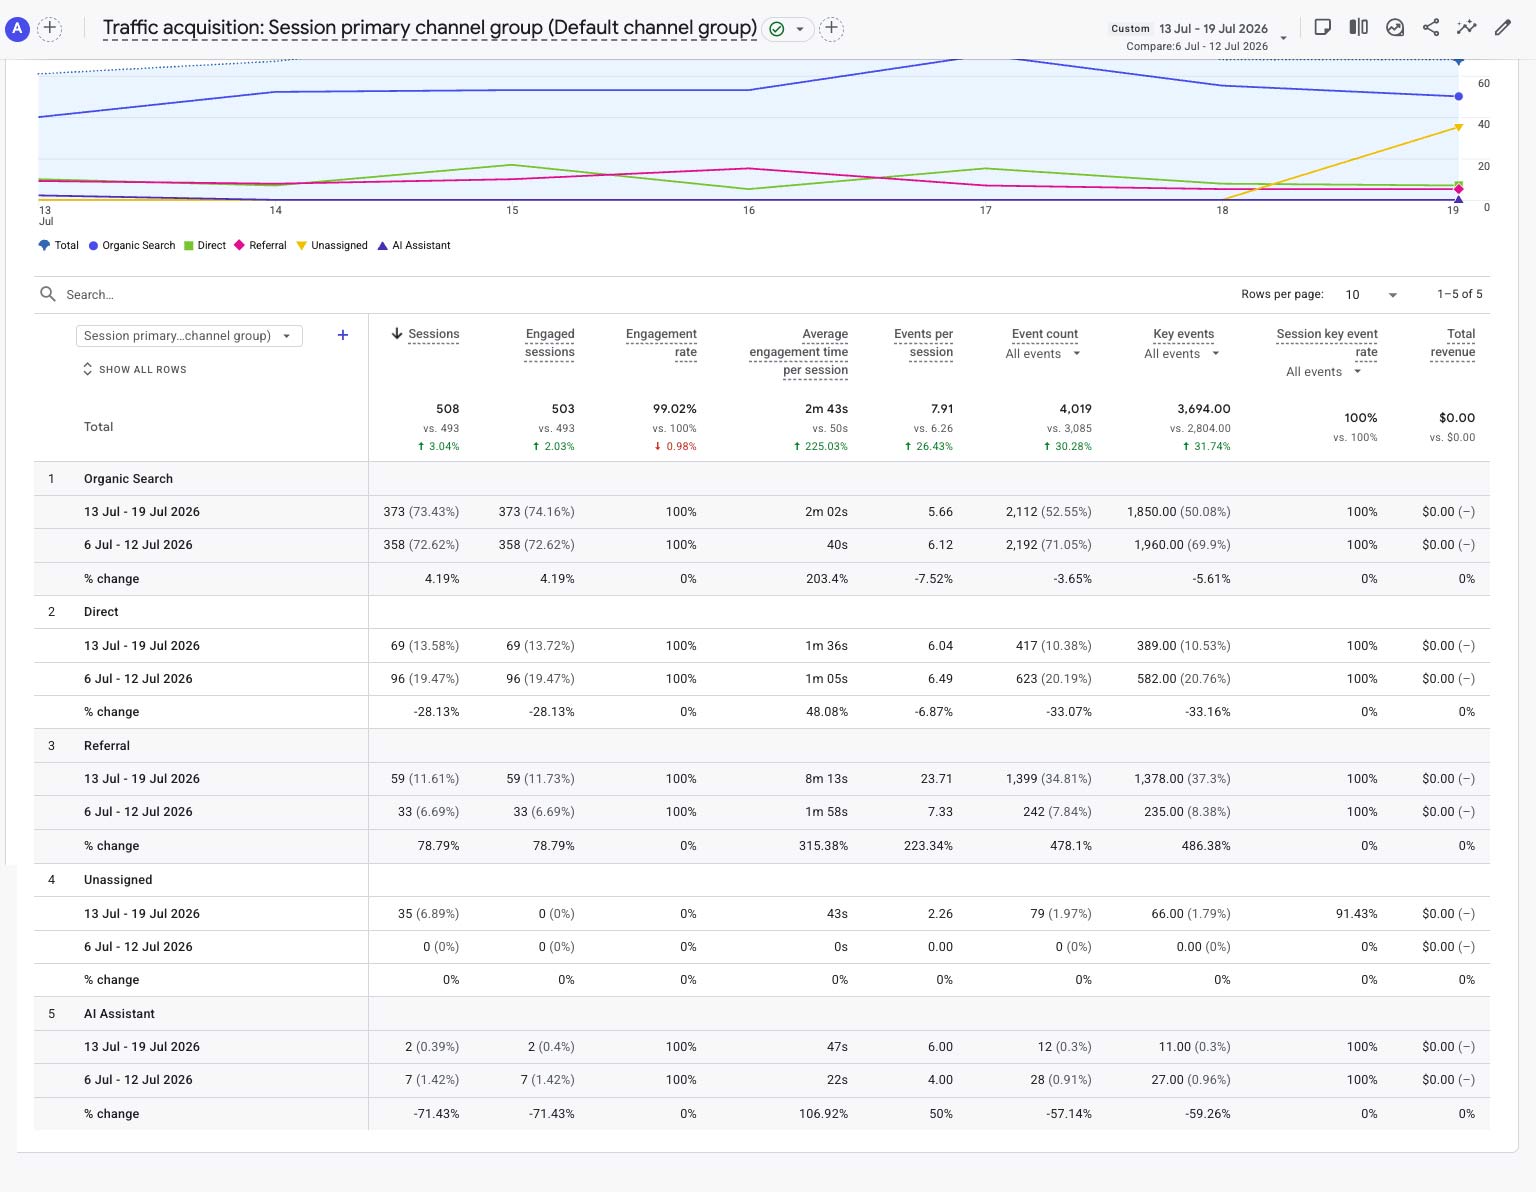
| SEO Momentum | Strong | Organic sessions increased 4.2% and supplied 73.4% of total sessions. |
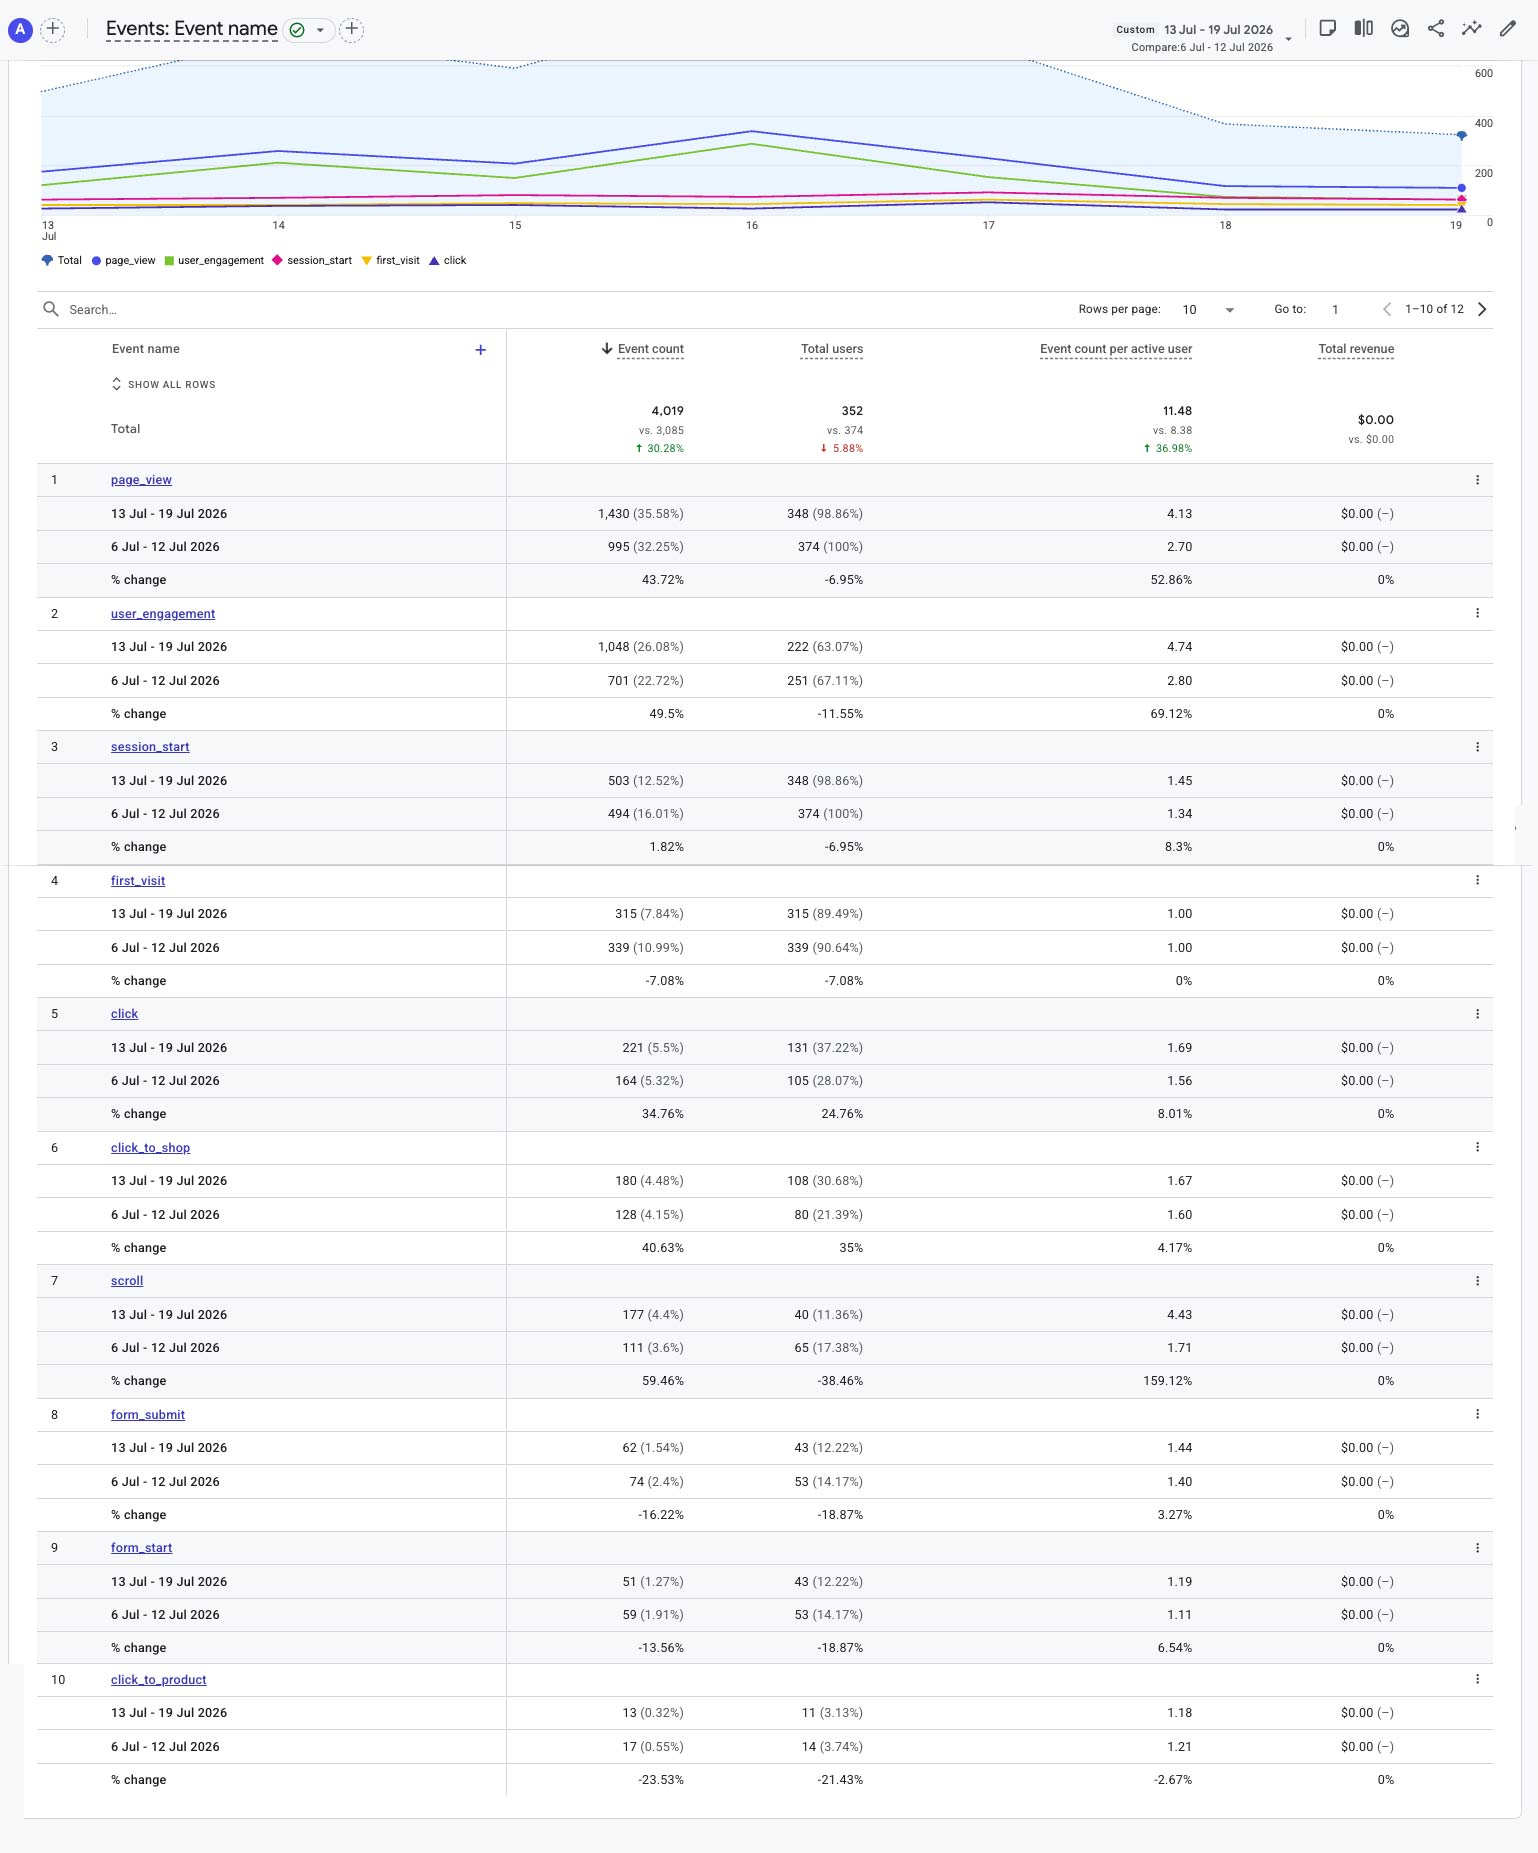
| Customer Intent | Accelerating | Click-to-Shop increased 40.6% to 180. |
| Engagement Depth | Excellent | Average engagement time increased to 3m 57s. |
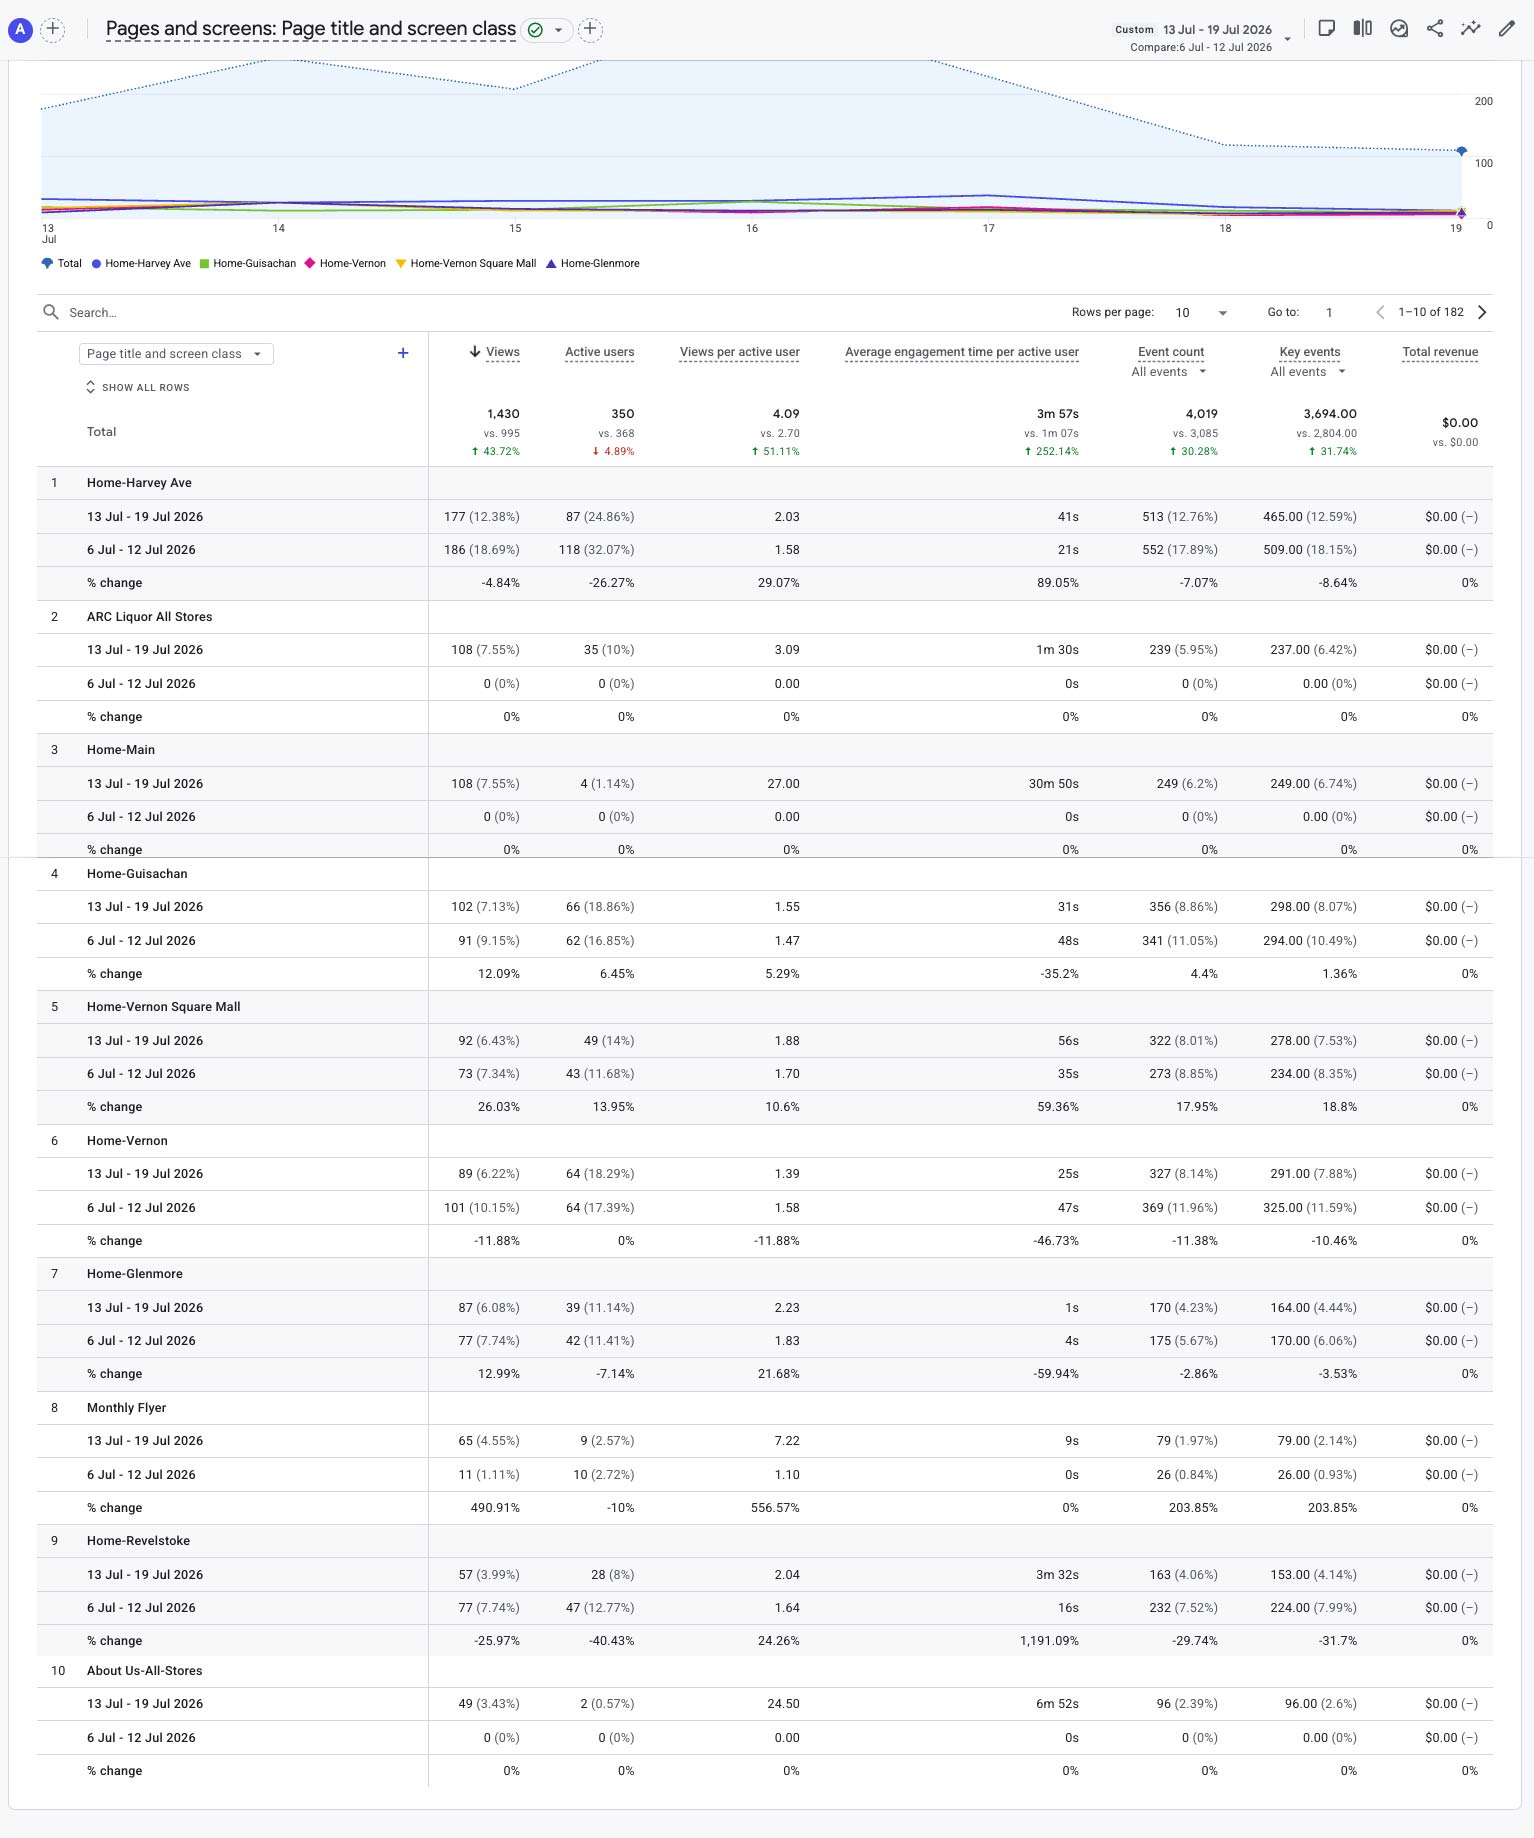
| Brand Structure | Milestone | The new all-store gateway recorded 108 opening-week views. |
| New-user Reach | Watch | New users declined 7.1% despite stronger session activity. |
Weekly Wins
- Click-to-Shop rose 40.6% to 180.
- Page views increased 43.7%.
- Total events increased 30.3%.
- Average engagement time increased 252.1%.
- Referral sessions increased 78.8%.
- The new all-store gateway attracted 108 views.
- Monthly Flyer views increased to 65.
Watch List
- Direct sessions declined 28.1%.
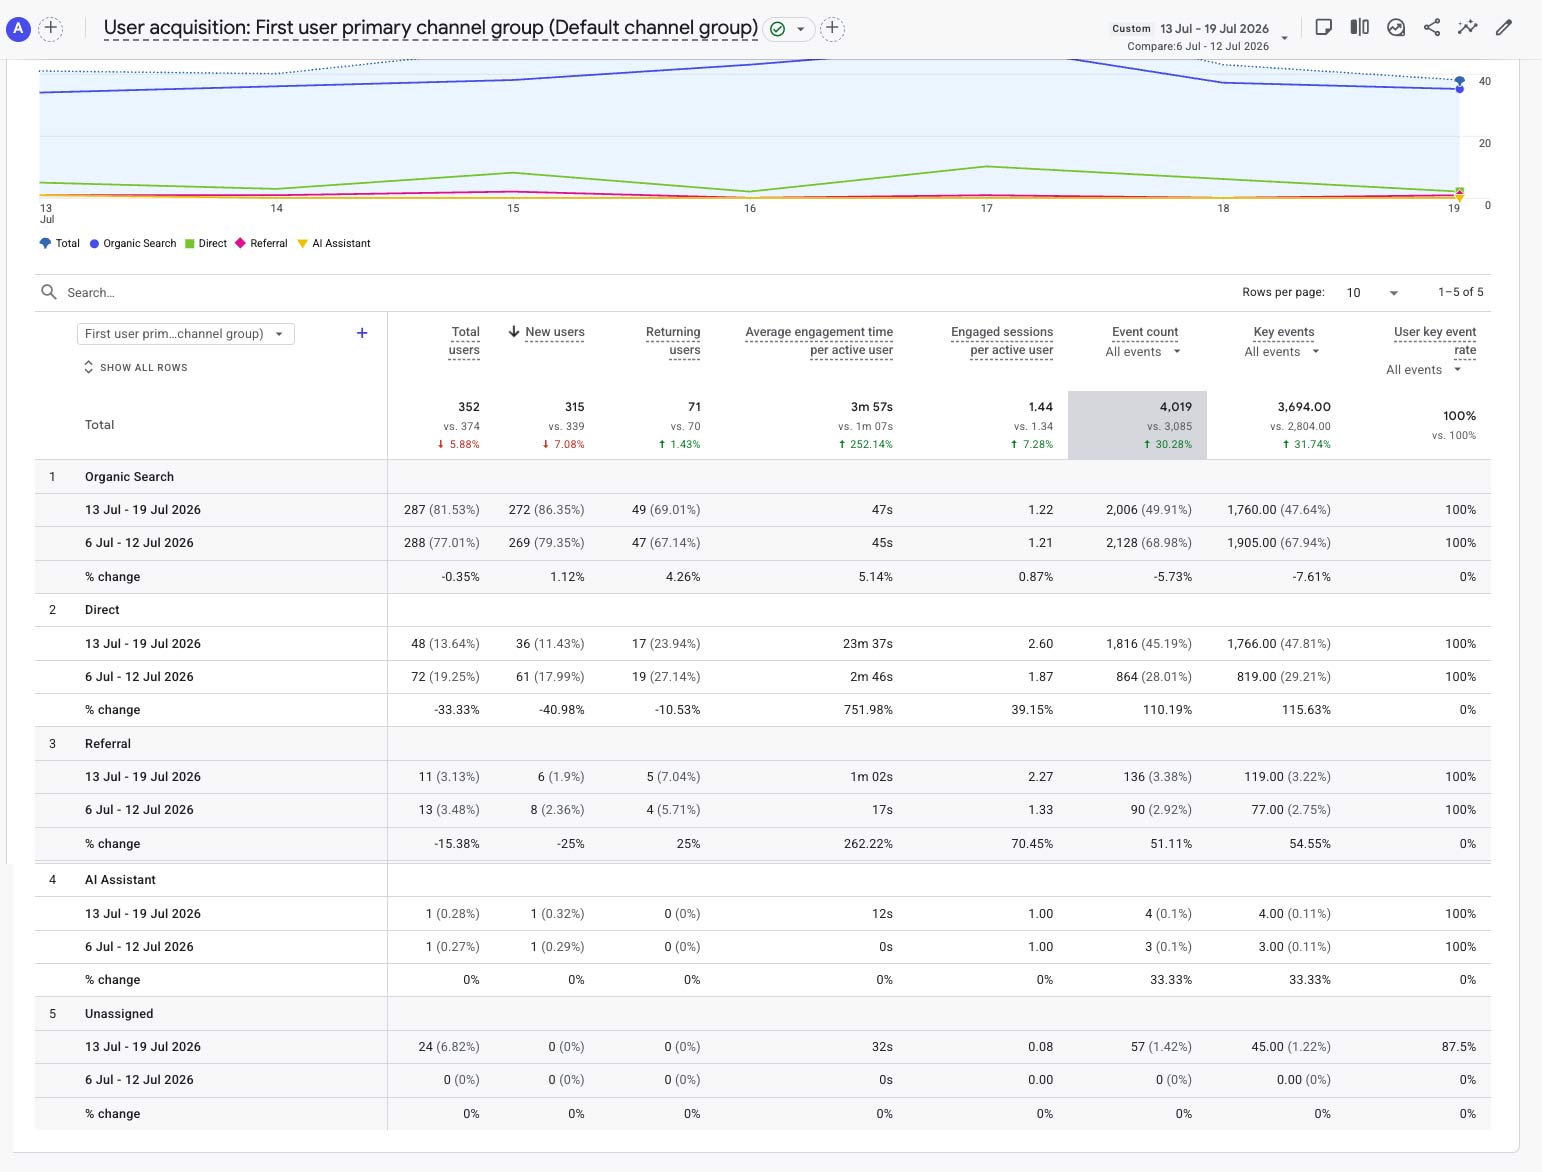
- New users declined 7.1%.
- Form submissions declined 16.2%.
- Unassigned traffic reached 35 sessions.
Digital Milestone: ARC's Unified Gateway
Previously, visitors entering arcliquorstores.ca were directed to the Harvey Avenue store, which naturally concentrated traffic and exposure on that location. The new ARC Liquor All Stores homepage now introduces the ARC brand first and provides a balanced gateway to all six store experiences.
Opening-week result: 108 views, placing the new gateway among the most-viewed pages immediately after launch.
Individual Google Business Profiles continue to send customers directly to their specific store pages, while the main domain now serves the wider ARC brand.
Performance Overview
Week 18 produced a stronger quality-of-visit story. Sessions increased modestly, but visitor activity expanded much faster: page views, event volume, scrolling, general clicks and shopping-path activity all rose sharply.
What this means: visitors were not merely arriving; they were exploring more pages, spending longer on the website and moving into ARC's e-commerce pathway more frequently.
| Metric | This Week | Previous | Change |
|---|---|---|---|
| Sessions | 508 | 493 | +3.0% |
| Engaged Sessions | 503 | 493 | +2.0% |
| Active Users | 350 | 368 | -4.9% |
| New Users | 315 | 339 | -7.1% |
| Page Views | 1,430 | 995 | +43.7% |
| Average Engagement Time | 3m 57s | 1m 07s | +252.1% |
| Event Count | 4,019 | 3,085 | +30.3% |
| Click-to-Shop | 180 | 128 | +40.6% |
Traffic Acquisition
| Channel | Sessions | Previous | Change | Interpretation |
|---|---|---|---|---|
| Organic Search | 373 | 358 | +4.2% | ARC's dominant acquisition source, supplying 73.4% of sessions. |
| Direct | 69 | 96 | -28.1% | Continued softness and the principal acquisition watch item. |
| Referral | 59 | 33 | +78.8% | Meaningful growth, with especially strong engagement and event activity. |
| Unassigned | 35 | 0 | New | Requires a review of UTM and source classification. |
| AI Assistant | 2 | 7 | -71.4% | Small volume; continue monitoring as an emerging source. |
Store and Content Performance
| Page | Views | Change |
|---|---|---|
| Home - Harvey Ave | 177 | -4.8% |
| ARC Liquor All Stores | 108 | New |
| Home - Guisachan | 102 | +12.1% |
| Home - Vernon Square Mall | 92 | +26.0% |
| Home - Vernon | 89 | -11.9% |
| Home - Glenmore | 87 | +13.0% |
| Monthly Flyer | 65 | +490.9% |
| Home - Revelstoke | 57 | -26.0% |
Interpretation
Harvey remained the leading store homepage, but the new all-store gateway now gives ARC a neutral brand-level entry point. Vernon Square Mall, Glenmore and Guisachan all recorded healthy growth, while the Monthly Flyer gained substantial visibility.
Revelstoke declined after the previous week's strong increase, which should be viewed over a multi-week trend rather than as a single-week concern.
Events and Customer Actions
| Event | Count | Change |
|---|---|---|
| page_view | 1,430 | +43.7% |
| user_engagement | 1,048 | +49.5% |
| session_start | 503 | +1.8% |
| first_visit | 315 | -7.1% |
| click | 221 | +34.8% |
| click_to_shop | 180 | +40.6% |
| scroll | 177 | +59.5% |
| form_submit | 62 | -16.2% |
| form_start | 51 | -13.6% |
| click_to_product | 13 | -23.5% |
Efficiency insight: session growth was only 3.0%, yet page views increased 43.7% and Click-to-Shop increased 40.6%. The website generated considerably more customer activity from a similar-sized audience.
AI & Digital Tools Update
The ARC digital ecosystem now combines a central brand gateway, six store websites, Google Business Profile pathways, Product Finders, conversational AI assistants, Voice AI assistants and store-specific shopping links.
The next stage is to document the repeatable processes and begin structured skills transfer. Short training modules will support Jason with routine website and flyer updates, while Colin's series will cover weekly CSV preparation, Knowledge Base updates and Gold Standard quality checks.
Recommended Actions
- Track how visitors move from the new gateway into each store page.
- Keep Click-to-Shop as the primary weekly commercial-intent measure.
- Review Unassigned traffic and standardize UTM tagging.
- Continue local SEO and referral-link development.
- Begin the ARC Digital Training Series for Jason and Colin.
- Monitor form and product-click activity for another week.
Trend Tracker
| Trend | Status | Why |
|---|---|---|
| Organic Search | Strong | 373 sessions and 73.4% of total traffic. |
| Click-to-Shop | Accelerating | Increased 40.6% to 180 actions. |
| Engagement Depth | Excellent | Time, views, events and scrolling all rose sharply. |
| Brand Gateway | Successful Launch | 108 views during its opening week. |
| New-user Reach | Watch | New users declined 7.1%. |
| Attribution Quality | Review | 35 sessions were classified as Unassigned. |
Supporting GA4 Reports
These images follow the numbered GA4 sequence and descriptive naming standard established for the weekly reporting package.