
ARC Liquor Stores
Weekly Reporting • GA4 + Intent Tracking
Weekly Performance Report
A weekly leadership snapshot covering traffic, engagement, store-page performance, acquisition channels and customer-intent actions across ARC's connected digital platform.
Alongside the established Gold Standard report, an enhanced leadership layout is available with a visual scorecard, trend tracker and expanded interpretation of the week's results.
Leadership takeaway (Week 19)
ARC recorded 474 sessions and 467 engaged sessions. Overall volume moderated after Week 19's stronger launch activity, with active users at 333, new users at 293, page views at 1,061, and total events at 3,215.
The strategically important story was the emergence of the Emily ecosystem. Meet Emily recorded 119 views, Ask Emily recorded 41 views, Featured Emily's Wine Selects recorded 31 views, and AI Assistant traffic increased from 2 to 29 sessions. Organic Search remained dominant with 350 sessions, representing 73.8% of all traffic.
Week 19 was a consolidation week rather than a growth week. The positive strategic development was that ARC's newer content and AI experiences became measurable, giving leadership an early view of how customers may engage with Emily, editorial wine content and AI-assisted discovery.
Weekly wins
- Meet Emily: 119 views, immediately becoming ARC's second most-viewed page.
- AI Assistant traffic: increased from 2 to 29 sessions.
- Organic visibility: 350 sessions, representing 73.8% of traffic.
- Form activity: form submissions increased to 67 and form starts increased to 56.
- Emily ecosystem: Ask Emily recorded 41 views and Featured Emily's Wine Selects recorded 31.
Watch list
- Overall volume: sessions, views and event activity softened after Week 19.
- Referral traffic: declined 49.2% to 30 sessions.
- Engagement depth: average engagement time declined to 2m 04s.
- Attribution: 32 Unassigned sessions require continued review.
PDF report download
The PDF contains the complete Week 19 analysis, supporting GA4 screenshots, page performance, acquisition data, event tracking and recommended actions.
Sessions: 474 • Engaged Sessions: 467 • Events: 3,215 • Click-to-Shop: 152Meet Emily: 119 views • AI Assistant: 29 sessionsARC Digital Scorecard
| Metric | Week 19 | Previous week | WoW change |
|---|---|---|---|
| Active users | 333 | 350 | ↓ 4.9% |
| New users | 293 | 315 | ↓ 7.0% |
| Sessions | 474 | 508 | ↓ 6.7% |
| Engaged sessions | 467 | 503 | ↓ 7.2% |
| Pages and screen views | 1,061 | 1,430 | ↓ 25.8% |
| Average engagement time per active user | 2m 04s | 3m 57s | ↓ 47.4% |
| Total event count | 3,215 | 4,019 | ↓ 20.0% |
| Click-to-Shop | 152 | 180 | ↓ 15.6% |
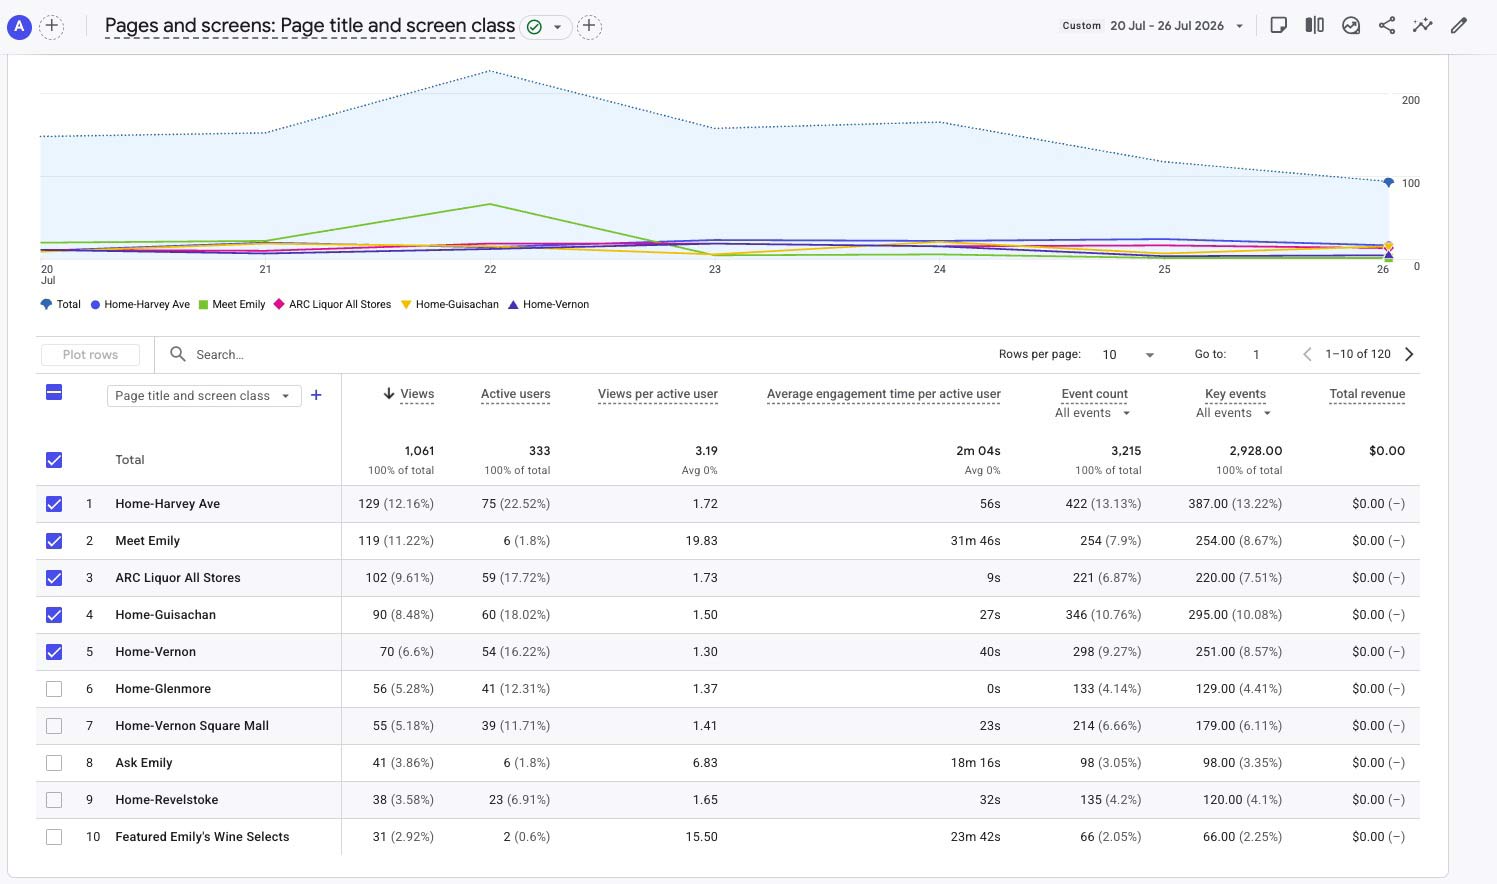
Harvey remained the leading store homepage. Meet Emily entered immediately as the second most-viewed page, while the ARC Liquor All Stores gateway retained a prominent position and the wider Emily ecosystem began attracting measurable attention.
| Page | Views | WoW note |
|---|---|---|
| Home–Harvey Ave | 129 | ↓ 27.1% |
| Meet Emily | 119 | New launch content |
| ARC Liquor All Stores | 102 | ↓ 5.6% |
| Home–Guisachan | 90 | ↓ 11.8% |
| Home–Vernon | 70 | ↓ 21.3% |
| Home–Glenmore | 56 | ↓ 35.6% |
| Home–Vernon Square Mall | 55 | ↓ 40.2% |
| Ask Emily | 41 | New / developing |
| Home–Revelstoke | 38 | ↓ 33.3% |
| Featured Emily's Wine Selects | 31 | New / developing |
ARC's audience is beginning to distribute beyond the Harvey homepage. Meet Emily, the All Stores gateway and the supporting Emily pages are creating new reasons to enter, explore and move through the wider ARC website.
Sessions by primary channel
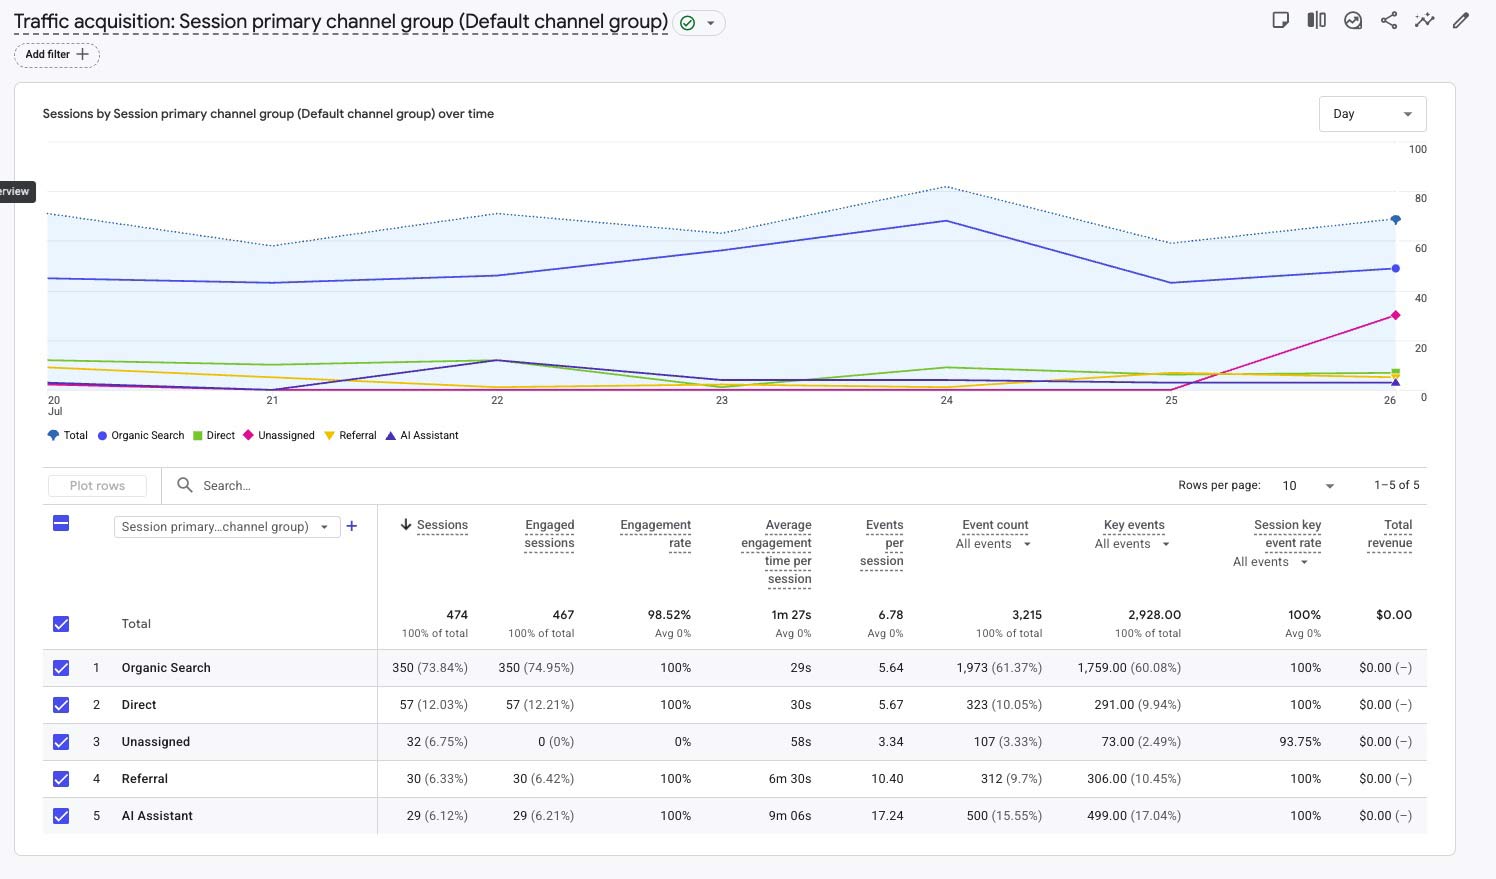
Organic Search remains ARC's dominant acquisition channel at 73.8% of sessions. The major emerging signal is AI Assistant traffic, which increased from 2 to 29 sessions. The percentage increase is amplified by the very small Week 19 baseline, so the absolute session count is the most useful leadership measure.
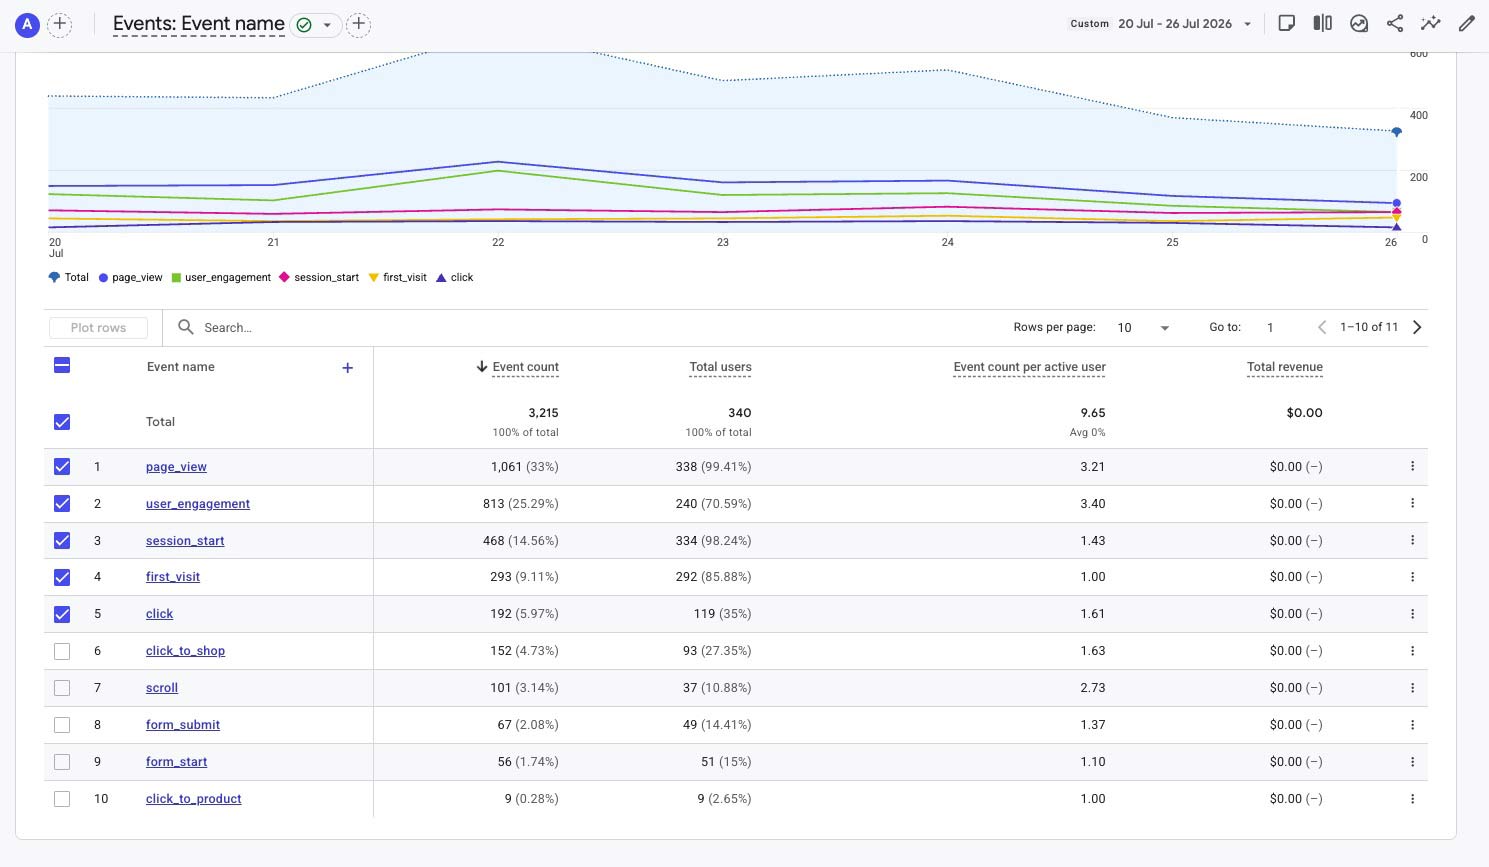
- page_view: 1,061 (↓ 25.8%)
- user_engagement: 813 (↓ 22.4%)
- session_start: 468 (↓ 7.0%)
- first_visit: 293 (↓ 7.0%)
- click: 192 (↓ 13.1%)
- click_to_shop: 152 (↓ 15.6%)
- scroll: 101 (↓ 42.9%)
- form_submit: 67 (↑ 8.1%)
- form_start: 56 (↑ 9.8%)
- click_to_product: 9 (↓ 30.8%)
Most event categories softened after Week 19, but form starts and form submissions improved. Click-to-Shop remained a meaningful commercial signal at 152 actions despite the lower overall traffic level.
Commercial actions
- click_to_shop: 152 (↓ 15.6%)
- click_to_product: 9 (↓ 30.8%)
- General clicks: 192 (↓ 13.1%)
- Form submissions: 67 (↑ 8.1%)
Commercial activity normalized after Week 19, but Click-to-Shop continued to demonstrate meaningful purchasing intent. The next tracking opportunity is to measure the path from Meet Emily and Summer Selects into Product Finder and Barnet shopping actions.
Digital System Progress
The ARC digital ecosystem now includes the unified homepage, six store experiences, Product Finders, conversational AI, Voice AI and the developing Emily brand journey. Week 20 is the first report where Meet Emily, Ask Emily, Summer Selects and AI Assistant acquisition can be discussed together as measurable parts of the same customer experience.
✅ Central ARC brand gateway
✅ Six individual store experiences
✅ Store-specific Product Finders
✅ Emily editorial and conversational journey
✅ AI acquisition now measurable- Track the Emily journey: measure clicks from Meet Emily to Summer Selects, Ask Emily, Product Finder and online shopping.
- Add campaign and QR tracking: use UTMs for the in-store Emily display and future social campaigns.
- Separate internal testing: exclude development traffic where practical so customer engagement becomes easier to interpret.
- Keep Organic Search central: it continues to supply nearly three quarters of all sessions.
- Review attribution: continue investigating Referral and Unassigned traffic.
- Use a three-week view: judge the softer Week 20 totals alongside Weeks 19 and 21 rather than in isolation.
Week 19 did not match Week 18's traffic and engagement peaks, but it provided strategically valuable evidence that ARC's newer customer experiences are beginning to attract attention. Meet Emily became the website's second most-viewed page, AI Assistant traffic increased to 29 sessions, and Organic Search continued to supply almost three quarters of all visits. The next phase is to separate customer usage from internal testing and connect the Emily journey more directly to measurable shopping actions.
Week 19 marked the point where Emily moved from a creative concept into a measurable ARC customer experience.
You can view the graphs and read the full analysis in the PDF report.
Click to download this reportGA4 Glossary (quick reference)
A quick guide to the core metrics used in this report.
Active users
Unique people who actively visited during the reporting window.
New users
First-time visitors in the reporting window.
Sessions
Total visits. One person can generate multiple sessions.
Engaged sessions
Sessions where the visitor showed meaningful engagement.
Event count
Total tracked interactions, including views, clicks, scrolls, forms and shopping actions.
Key events
Events marked as important in GA4 for conversion-style reporting.
Intent Tracking (ARC → Barnet)
click_to_shop
Outbound click from ARC into a store's Barnet shopping site.
click_to_product
Outbound click to a specific Barnet product page.
click_to_call
Tap or click on a store phone number.