
ARC Liquor Stores
Weekly Reporting • GA4 + Intent Tracking
Weekly Performance Report
A weekly leadership snapshot covering traffic, engagement, store-page performance, acquisition channels and customer-intent actions across ARC's connected digital platform.
Alongside the established Gold Standard report, the enhanced leadership layout provides the visual scorecard, trend tracker and expanded interpretation.
Leadership takeaway (Week 28)
ARC had a quieter week for reach and shopping action. Sessions declined to 343 (-16.5%), Organic Search to 245 (-17.8%), and Click-to-Shop to 83 (-24.5%). Form submissions rose to 41 (+32.3%), while Vernon Square Mall reached 56 views (+69.7%). The near-term task is to understand the search and Harvey declines while protecting the improved enquiry path.
Engaged Sessions were 338 (▼16.5%), Active Users 251 (▼20.3%), New Users 215 (▼22.7%) and average engagement 1m 00s (▼4.8%). The gains in forms are encouraging, but do not erase the drop in shopping clicks.
Search and Direct traffic weakened, with fewer visitors reaching shopping links. Enquiries improved despite the smaller audience. Review the pages and links behind those changes before attributing them to site performance alone.
Weekly wins
- Form submissions increased from 31 to 41 (+32.3%).
- Form starts increased from 24 to 28 (+16.7%).
- Vernon Square Mall rose from 33 to 56 views (+69.7%).
- Vernon 58th Avenue rose from 45 to 52 views (+15.6%).
- AI Assistant traffic increased from 15 to 19 sessions (+26.7%).
Watch list
- Sessions fell to 343 (-16.5%) and new users to 215 (-22.7%).
- Organic Search fell to 245 sessions (-17.8%); Direct fell to 50 (-31.5%).
- Click-to-Shop fell to 83 (-24.5%) and Click-to-Product to 7 (-41.7%).
- Harvey page views fell from 147 to 105 (-28.6%).
- 28 sessions were Unassigned, up from 23.
PDF report download
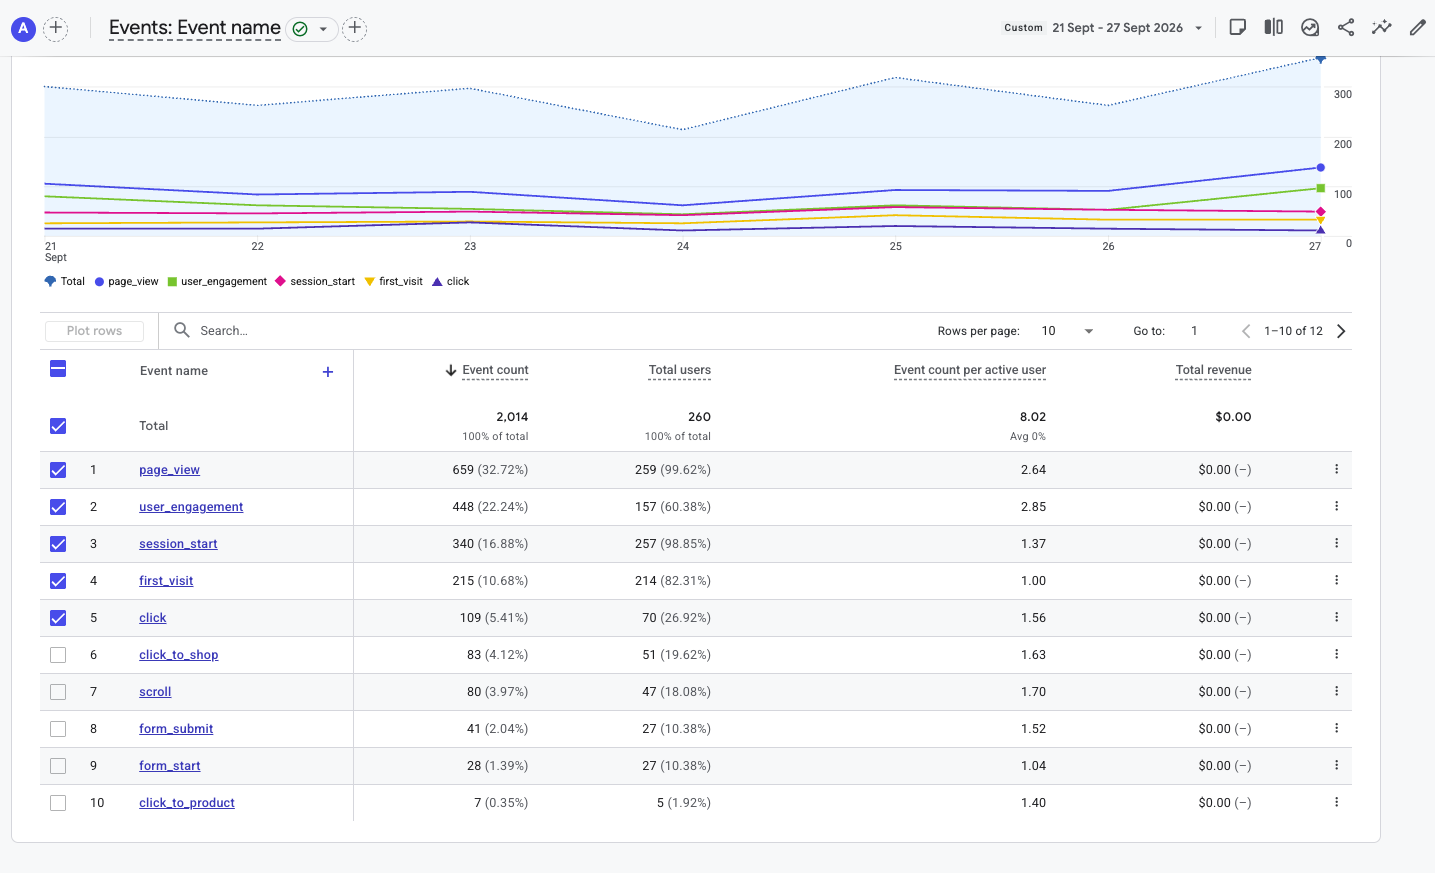
The PDF contains the complete Week 28 analysis, supporting GA4 screenshots, acquisition data, store-page performance, event tracking and recommended actions.
Sessions: 343 • Organic Search: 245 • Form Submissions: 41 • Click-to-Shop: 83| Metric | Week 28 | WoW change |
|---|---|---|
| Sessions | 343 | ▼ 16.5% |
| Engaged Sessions | 338 | ▼ 16.5% |
| Active Users | 251 | ▼ 20.3% |
| New Users | 215 | ▼ 22.7% |
| Page Views | 659 | ▼ 21.2% |
| Avg Engagement | 1m 00s | ▼ 4.8% |
| Total Events | 2,014 | ▼ 19.8% |
| Key Events | 1,851 | ▼ 20.6% |
| Click-to-Shop | 83 | ▼ 24.5% |
Week-over-week changes use the saved Week 27 leadership report as the baseline. GA4 screenshot comparison arrows may differ after later data processing.
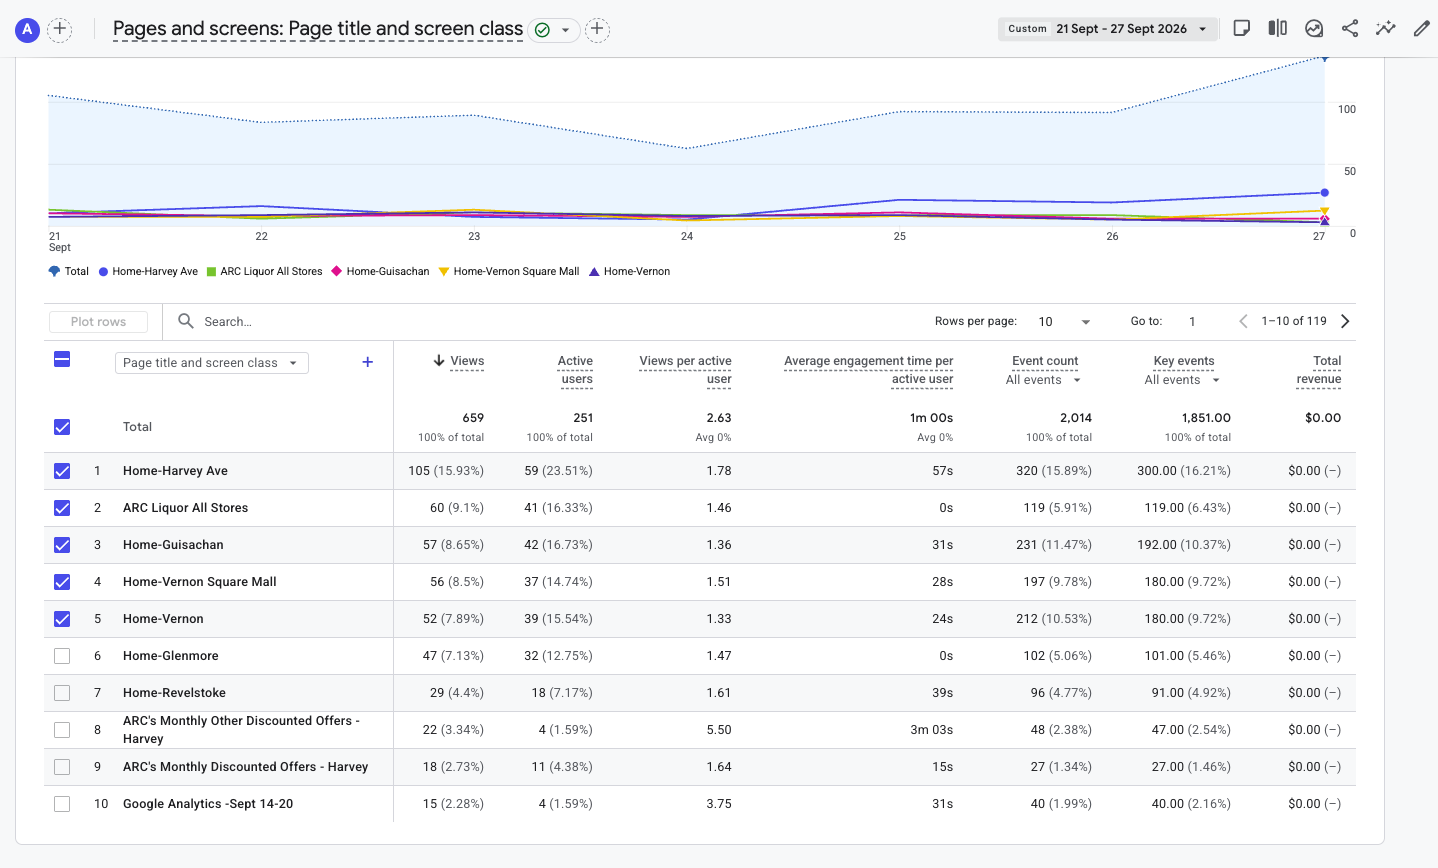
Harvey remained the most-viewed store homepage at 105, though down from 147. Vernon Square Mall and Vernon 58th Avenue gained views. The monthly discount pages entered the visible Top 10, while Featured Emily's Wine Selects and Ask Emily did not appear in this Top 10 screenshot; this does not establish zero views.
| Page | Views | WoW note |
|---|---|---|
| Home-Harvey Ave | 105 | ▼ 28.6% |
| ARC Liquor All Stores | 60 | ▼ 4.8% |
| Home-Guisachan | 57 | ▼ 1.7% |
| Home-Vernon Square Mall | 56 | ▲ 69.7% |
| Home-Vernon | 52 | ▲ 15.6% |
| Home-Glenmore | 47 | ▲ 11.9% |
| Home-Revelstoke | 29 | ▼ 25.6% |
| Monthly Other Discounted Offers - Harvey | 22 | No saved baseline |
| Monthly Discounted Offers - Harvey | 18 | No saved baseline |
| Week 27 GA4 report | 15 | No saved baseline |
Vernon Square Mall rose to 56 (+69.7%) and Vernon 58th Avenue to 52 (+15.6%). Harvey fell to 105 (-28.6%). View counts describe attention to pages, not confirmed store sales.
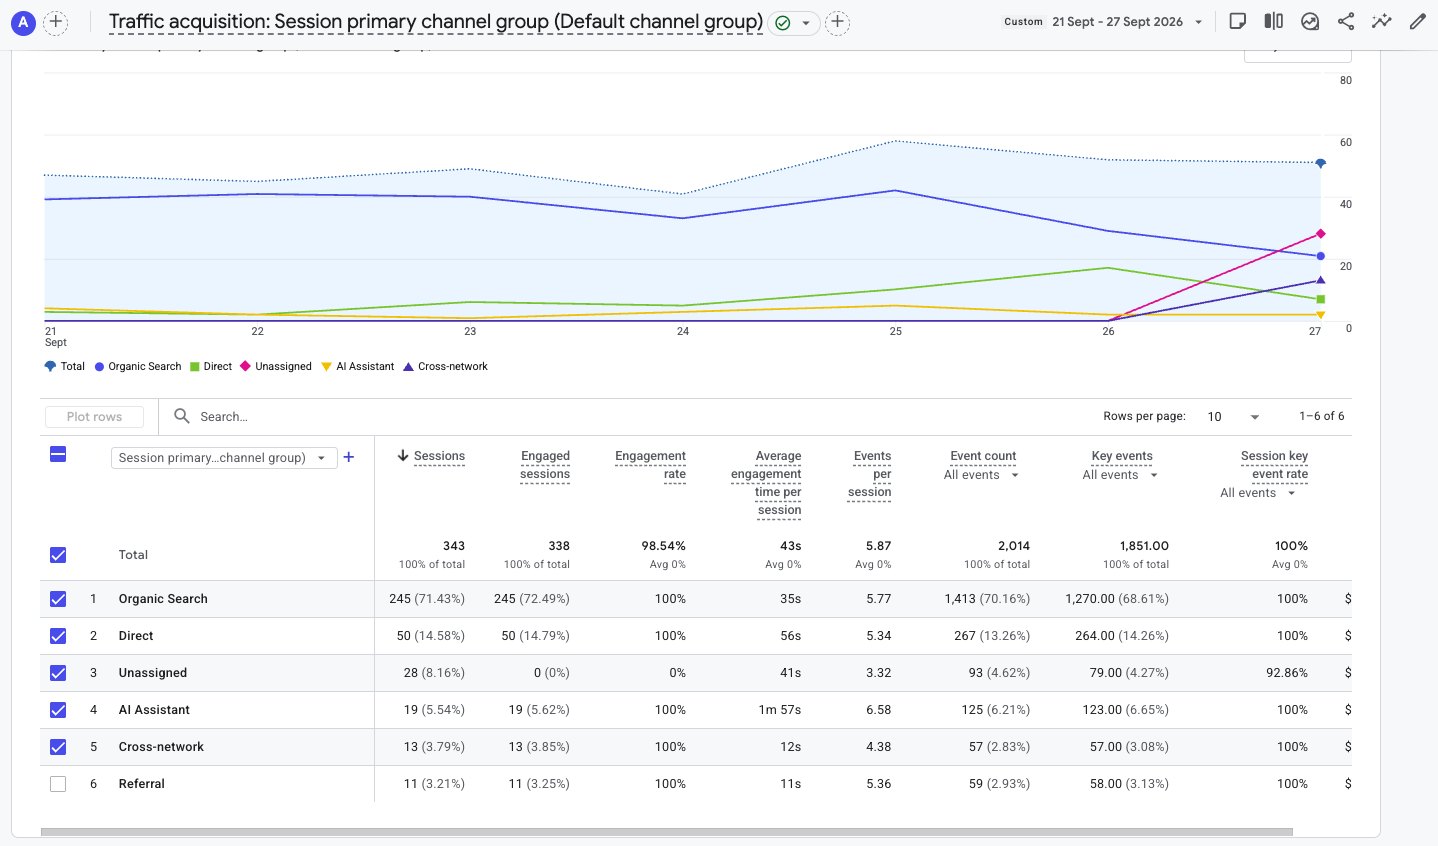
| Channel | Sessions | WoW note |
|---|---|---|
| Organic Search | 245 | ▼ 17.8% |
| Direct | 50 | ▼ 31.5% |
| Unassigned | 28 | ▲ 21.7% |
| AI Assistant | 19 | ▲ 26.7% |
| Cross-network | 13 | ▲ 116.7% |
| Referral | 11 | ▼ 8.3% |
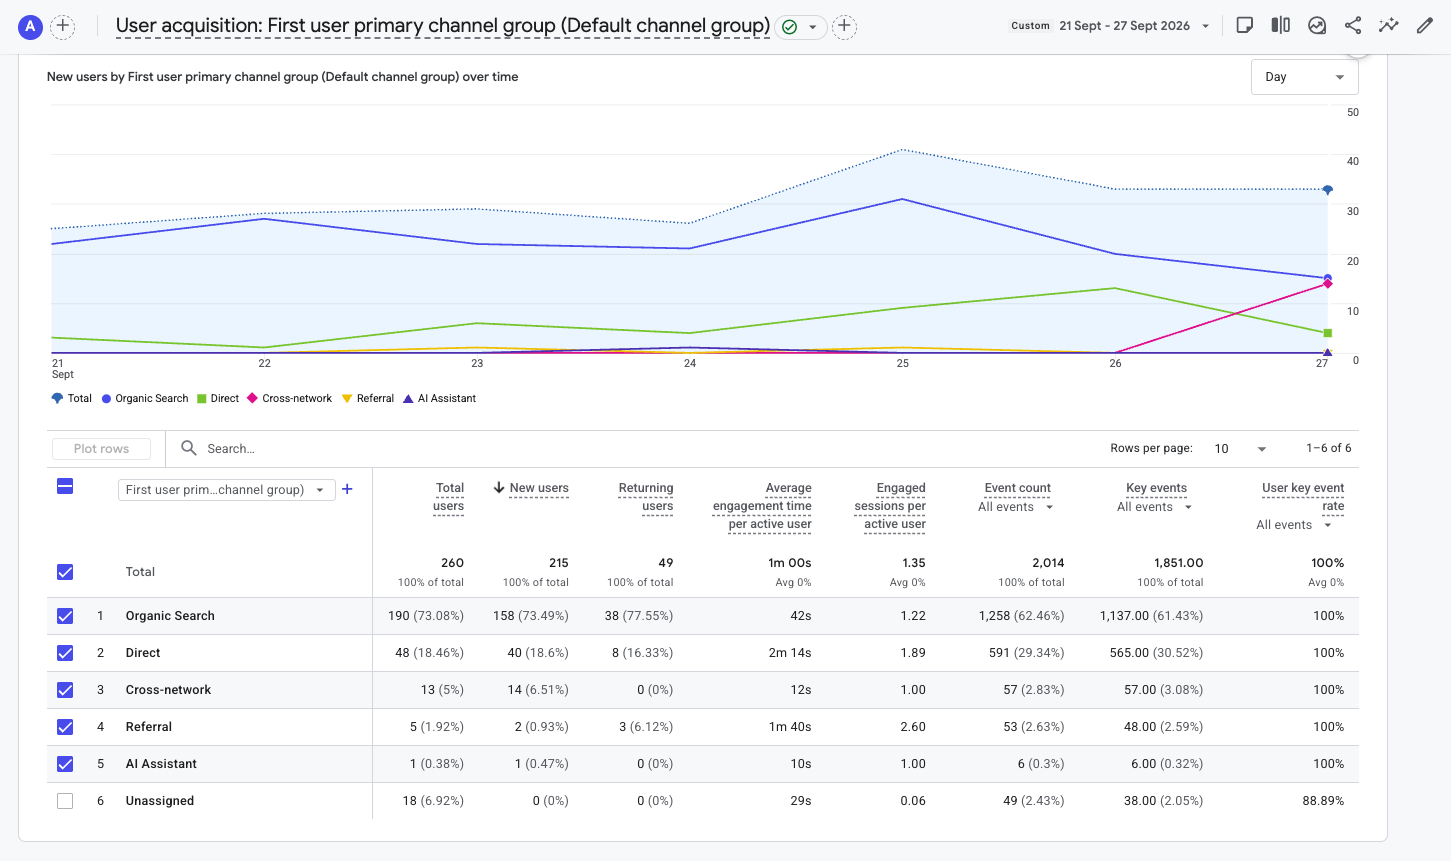
Organic Search contributed 245 of 343 sessions (71.43%), even as its volume declined. AI Assistant sessions rose from 15 to 19, but average engagement fell from 7m 19s to 1m 57s; small weekly samples require care.
| Event | Week 28 | WoW change |
|---|---|---|
| page_view | 659 | ▼ 21.2% |
| user_engagement | 448 | ▼ 20.1% |
| session_start | 340 | ▼ 16.0% |
| first_visit | 215 | ▼ 22.7% |
| click | 109 | ▼ 24.3% |
| click_to_shop | 83 | ▼ 24.5% |
| scroll | 80 | ▼ 24.5% |
| form_submit | 41 | ▲ 32.3% |
| form_start | 28 | ▲ 16.7% |
| click_to_product | 7 | ▼ 41.7% |
Form submissions rose 32.3% and starts 16.7%. Click-to-Shop declined 24.5% and Click-to-Product 41.7%. The current data shows stronger enquiries, alongside weaker measured shopping actions.
Click-to-Shop: 83 actions. Total clicks: 109. Form submissions: 41. Form starts: 28. Click-to-Product: 7.
Less traffic moved from ARC content toward the shopping path this week. Meanwhile, more visitors completed forms. Compare the changed pages and call-to-action placement, and check GA4 event definitions, before drawing a conversion-rate conclusion.
- Organic Search: examine Search Console queries and landing pages behind the fall to 245 sessions.
- Customer journey: audit the 83 Click-to-Shop and seven Click-to-Product actions, including tracking and links.
- Forms: identify which pages produced 41 submissions and whether these were qualified enquiries.
- Store pages: learn from Vernon Square Mall's 56 views, and check Harvey's decline to 105.
- AI Assistant: monitor the 19 sessions and the shorter engagement time without over-interpreting a small sample.
- Attribution: review 28 Unassigned sessions.
ARC had a quieter week for reach and shopping action. Sessions declined to 343 (-16.5%), Organic Search to 245 (-17.8%), and Click-to-Shop to 83 (-24.5%). Form submissions rose to 41 (+32.3%), while Vernon Square Mall reached 56 views (+69.7%). The near-term task is to understand the search and Harvey declines while protecting the improved enquiry path.
Week 28 brought fewer visitors and fewer shopping clicks, while form submissions and the Vernon store pages moved in the right direction.
You can view the graphs and read the full analysis in the PDF report.
Click to download this report