Enhanced Leadership Performance Report
A leadership-focused interpretation of ARC's digital performance, customer intent, acquisition quality and emerging opportunities.
ARC Digital Scorecard
Traffic and shopping action fell, while forms and Vernon store pages improved. This score is an editorial leadership assessment, not a native GA4 metric.
| Area | Status | Assessment |
|---|---|---|
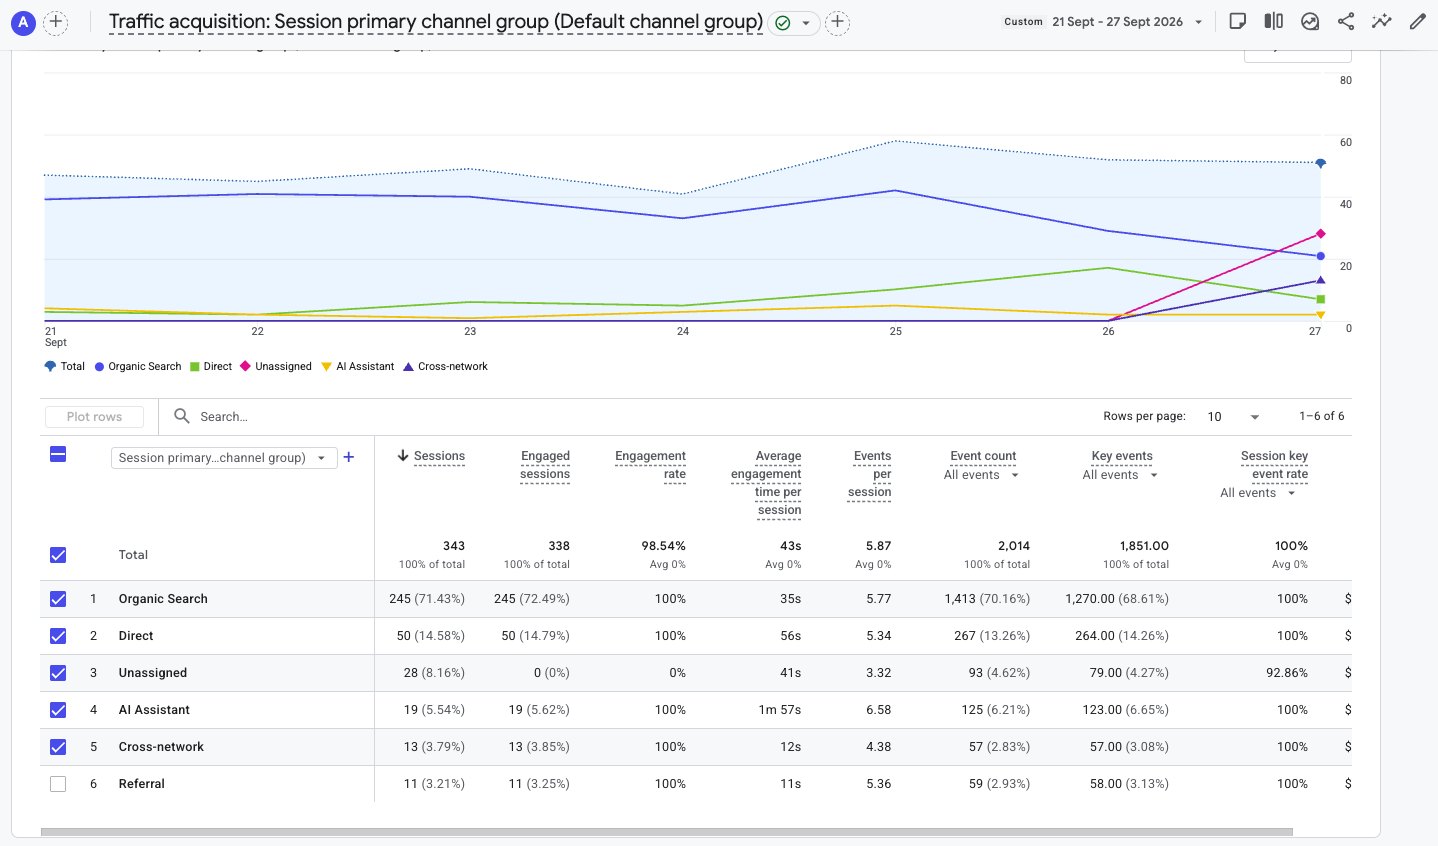
| SEO Momentum | Watch | Organic Search fell 17.8% to 245 sessions. |
| Audience Reach | Lower | Sessions -16.5%; active users -20.3%. |
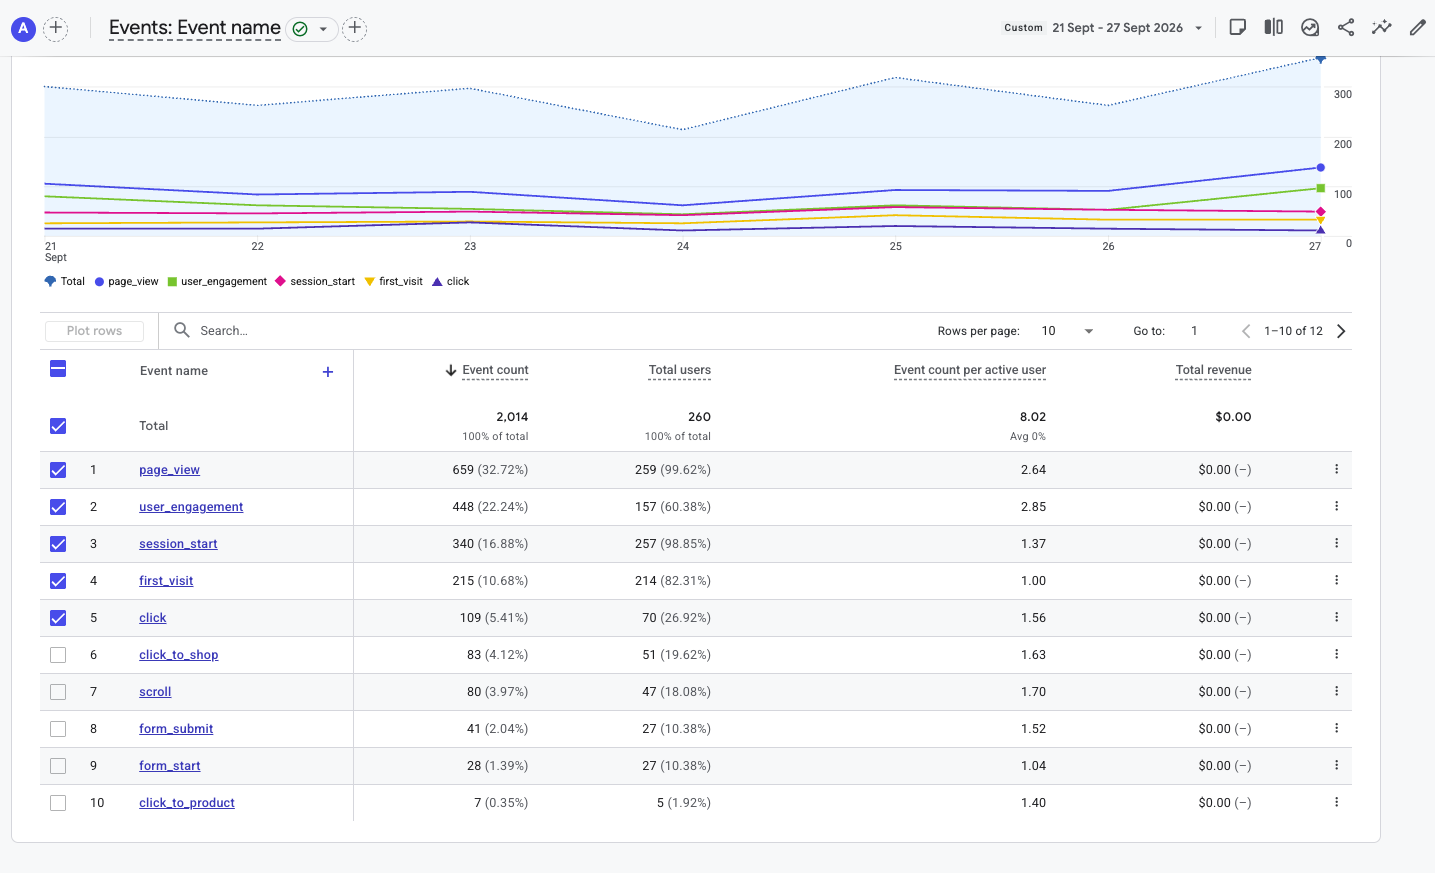
| Customer Intent | Mixed | Click-to-Shop 83 (-24.5%); form submissions 41 (+32.3%). |
| AI Acquisition | Mixed | 19 sessions (+26.7%) with 1m 57s engagement. |
| Attribution | Review | 28 Unassigned sessions. |
Weekly Wins
- Form submissions increased from 31 to 41 (+32.3%).
- Form starts increased from 24 to 28 (+16.7%).
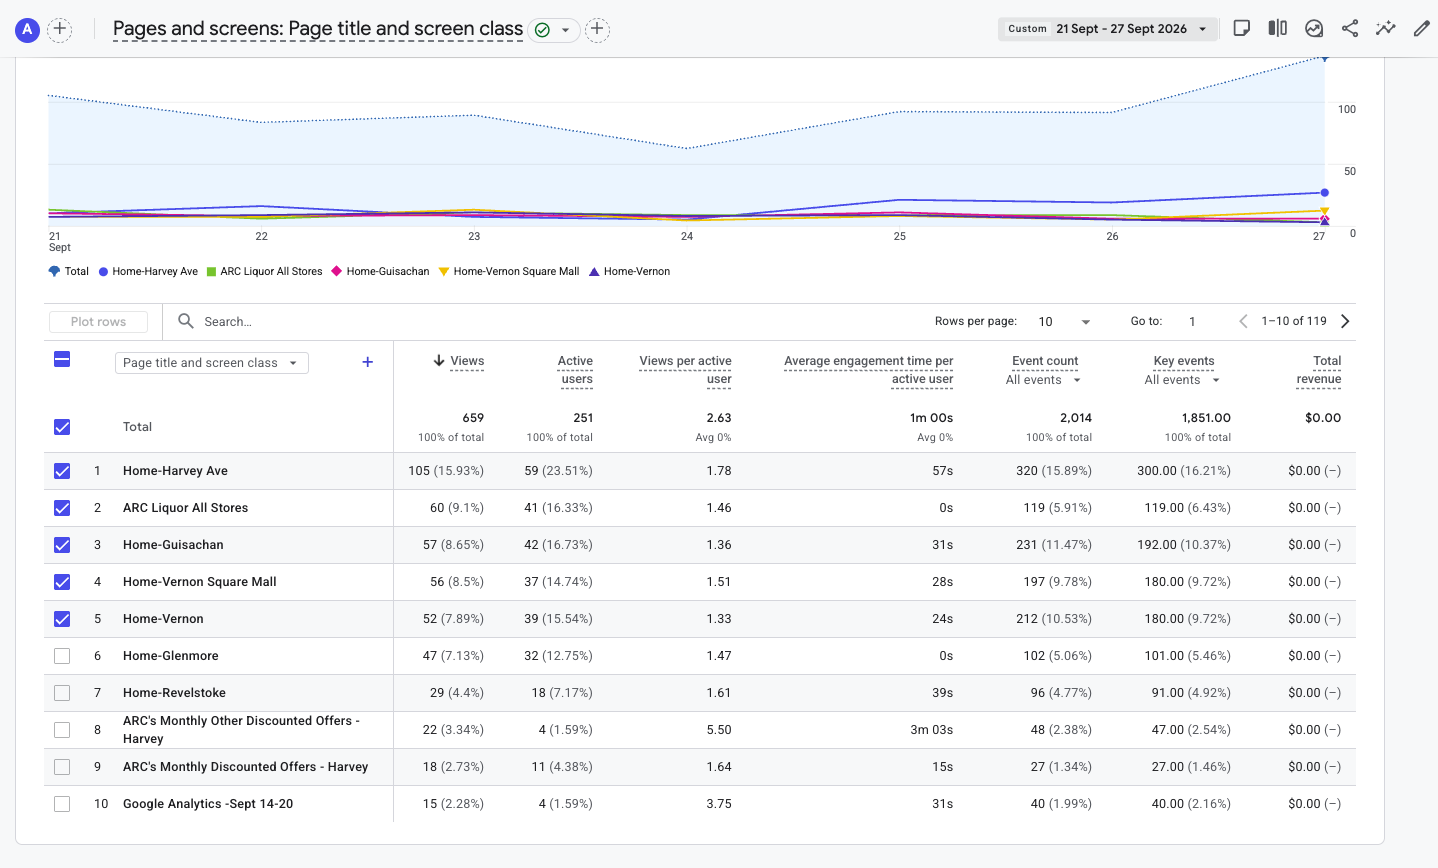
- Vernon Square Mall rose from 33 to 56 views (+69.7%).
- Vernon 58th Avenue rose from 45 to 52 views (+15.6%).
- AI Assistant traffic increased from 15 to 19 sessions (+26.7%).
Watch List
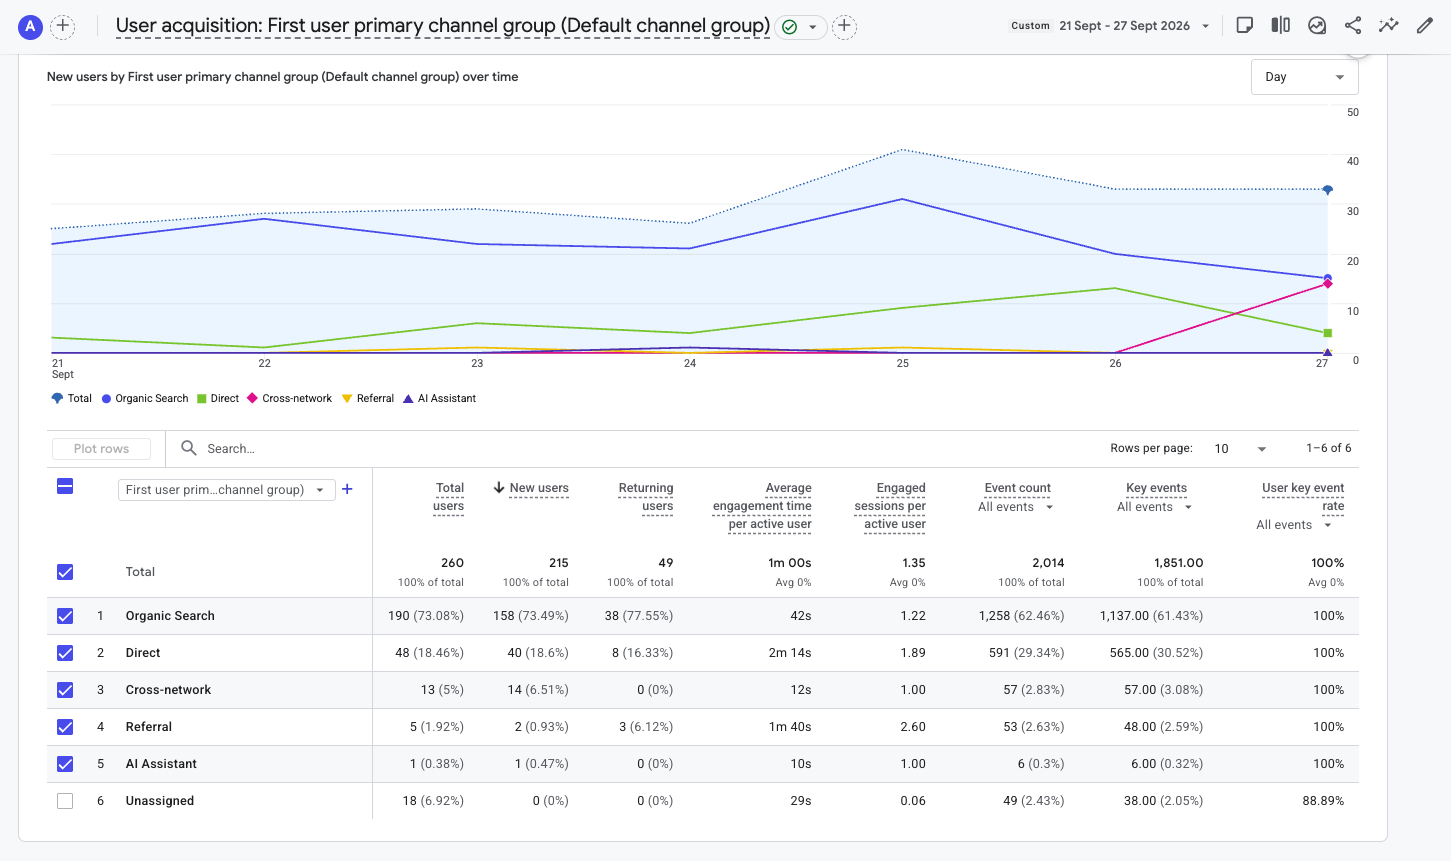
- Sessions fell to 343 (-16.5%) and new users to 215 (-22.7%).
- Organic Search fell to 245 sessions (-17.8%); Direct fell to 50 (-31.5%).
- Click-to-Shop fell to 83 (-24.5%) and Click-to-Product to 7 (-41.7%).
- Harvey page views fell from 147 to 105 (-28.6%).
- 28 sessions were Unassigned, up from 23.
Week 28: Enquiries Rise During a Quieter Week
ARC attracted fewer visits than in the saved Week 27 report. Organic and Direct both declined, and measured shopping clicks weakened. Yet the number of completed forms rose from 31 to 41.
Leadership interpretation: investigate which landing pages lost traffic and which gained enquiries. These contrasting signals deserve separate explanations.
Performance Overview
| Metric | This Week | Change |
|---|---|---|
| Sessions | 343 | ▼ 16.5% |
| Engaged Sessions | 338 | ▼ 16.5% |
| Active Users | 251 | ▼ 20.3% |
| New Users | 215 | ▼ 22.7% |
| Page Views | 659 | ▼ 21.2% |
| Avg Engagement | 1m 00s | ▼ 4.8% |
| Total Events | 2,014 | ▼ 19.8% |
| Key Events | 1,851 | ▼ 20.6% |
| Click-to-Shop | 83 | ▼ 24.5% |
Week-over-week changes use the saved Week 27 leadership report as the baseline. GA4 screenshot comparison arrows may differ after later data processing.
Traffic Acquisition
| Channel | Sessions | Change | Leadership Read |
|---|---|---|---|
| Organic Search | 245 | ▼ 17.8% | 71.43% of sessions; still the primary acquisition source. |
| Direct | 50 | ▼ 31.5% | 14.58% of sessions; its decline accounts for 23 fewer sessions. |
| Unassigned | 28 | ▲ 21.7% | 8.16% of sessions; attribution needs review. |
| AI Assistant | 19 | ▲ 26.7% | Volume rose, but average engagement was 1m 57s versus 7m 19s last week. |
| Cross-network | 13 | ▲ 116.7% | Small base; increase of seven sessions. |
| Referral | 11 | ▼ 8.3% | Small base; down one session. |
Store and Content Performance
| Page | Views |
|---|---|
| Home-Harvey Ave | 105 |
| ARC Liquor All Stores | 60 |
| Home-Guisachan | 57 |
| Home-Vernon Square Mall | 56 |
| Home-Vernon | 52 |
| Home-Glenmore | 47 |
| Home-Revelstoke | 29 |
| Monthly Other Discounted Offers - Harvey | 22 |
| Monthly Discounted Offers - Harvey | 18 |
| Week 27 GA4 report | 15 |
Interpretation
Harvey remained the largest store page at 105 views but lost 42 versus Week 27. Vernon Square Mall gained 23 to reach 56, and Vernon 58th gained seven to reach 52. Featured Emily's Wine Selects and Ask Emily were absent from the visible Top 10; their exact Week 28 totals are not shown in the supplied screenshot.
Customer Intent
| Action | Week 28 | Change |
|---|---|---|
| Total Clicks | 109 | ▼ 24.3% |
| Click-to-Shop | 83 | ▼ 24.5% |
| Form Submissions | 41 | ▲ 32.3% |
| Form Starts | 28 | ▲ 16.7% |
| Click-to-Product | 7 | ▼ 41.7% |
What this means: form completions increased while shopping clicks declined. Review the sources and quality of new enquiries, and audit the product links and their measurement.
AI Assistant Signal
AI Assistant sessions increased from 15 to 19 (+26.7%). Average engagement for these sessions was 1m 57s, down from 7m 19s last week; GA4 shows 125 events, or 6.58 per session. A small channel can swing sharply from week to week.
Recommended Actions
- Investigate the Organic Search and Direct traffic declines.
- Check the product-to-shopping journey and event definitions.
- Review the 41 form submissions by landing page and lead quality.
- Compare Harvey and Vernon store-page changes.
- Monitor the AI Assistant channel across several weeks.
- Resolve the 28 Unassigned sessions.
Trend Tracker
| Signal | Status | Leadership Read |
|---|---|---|
| Organic Search | Watch | 245 sessions, down 17.8%. |
| Audience Reach | Lower | Sessions 343; new users 215. |
| Shopping Intent | Watch | Click-to-Shop declined to 83. |
| Forms | Improving | Submissions increased to 41. |
| Store Pages | Vernon Growth | Square Mall 56 views; 58th Avenue 52. |
| Attribution | Review | 28 Unassigned sessions. |
Supporting GA4 Reports
These screenshots follow the approved descriptive naming convention for Week 28. Week-over-week changes use the saved Week 27 leadership report as the baseline. GA4 screenshot comparison arrows may differ after later data processing.