
ARC Liquor Stores
Weekly Reporting • GA4 + Intent Tracking
Weekly Performance Report
A weekly leadership snapshot covering traffic, engagement, store-page performance, acquisition channels and customer-intent actions across ARC's connected digital platform.
Alongside the established Gold Standard report, an enhanced leadership layout is available with a visual scorecard, trend tracker and expanded interpretation of the week's results.
Leadership takeaway (Week 20)
ARC recorded 493 sessions and 488 engaged sessions, increasing 3.6% and 3.0% respectively. Active users rose to 372 (+11.0%) and new users increased to 342 (+14.8%), showing stronger reach and customer acquisition.
The strongest acquisition story was Organic Search, which increased to 400 sessions (+13.0%) and accounted for 81.1% of all sessions. Overall event activity softened to 2,998, while customer actions remained resilient: clicks increased to 198, form submissions rose to 73, form starts increased to 62, and Click-to-Shop held at 148.
Week 20 delivered broader reach and stronger acquisition, led by Organic Search. Customers increased, sessions grew and several store pages improved. The main trade-off was lower average engagement time and reduced total event volume, indicating that the site attracted more people but generated fewer interactions per visitor.
Weekly wins
- Organic Search: increased to 400 sessions (+13.0%) and represented 81.1% of traffic.
- Audience growth: active users increased 11.0% and new users increased 14.8%.
- Store-page growth: Vernon (+28.2%), Vernon Square Mall (+40.0%), Glenmore (+19.6%) and Revelstoke (+13.2%).
- Customer actions: clicks rose 2.1%, form submissions 7.4%, form starts 8.8%, and product clicks 11.1%.
- Monthly Flyer: increased 52.9% to 26 views.
Watch list
- Engagement depth: average engagement time declined 46.8% to 1m 06s.
- Total event activity: declined 7.6% to 2,998.
- Emily content: Meet Emily, Ask Emily and Featured Emily's Wine Selects declined after launch-period activity.
- Attribution: Unassigned traffic increased to 29 sessions and requires review.
PDF report download
The PDF contains the complete Week 20 analysis, supporting GA4 screenshots, page performance, acquisition data, event tracking and recommended actions.
Sessions: 493 • Engaged Sessions: 488 • Active Users: 372 • Click-to-Shop: 148Organic Search: 400 sessions • New Users: 342ARC Digital Scorecard
| Metric | Week 20 | Previous week | WoW change |
|---|---|---|---|
| Active users | 372 | 335 | ↑ 11.0% |
| New users | 342 | 298 | ↑ 14.8% |
| Sessions | 493 | 476 | ↑ 3.6% |
| Engaged sessions | 488 | 474 | ↑ 3.0% |
| Pages and screen views | 958 | 1,069 | ↓ 10.4% |
| Average engagement time per active user | 1m 06s | 2m 04s | ↓ 46.8% |
| Total event count | 2,998 | 3,246 | ↓ 7.6% |
| Click-to-Shop | 148 | 153 | ↓ 3.3% |
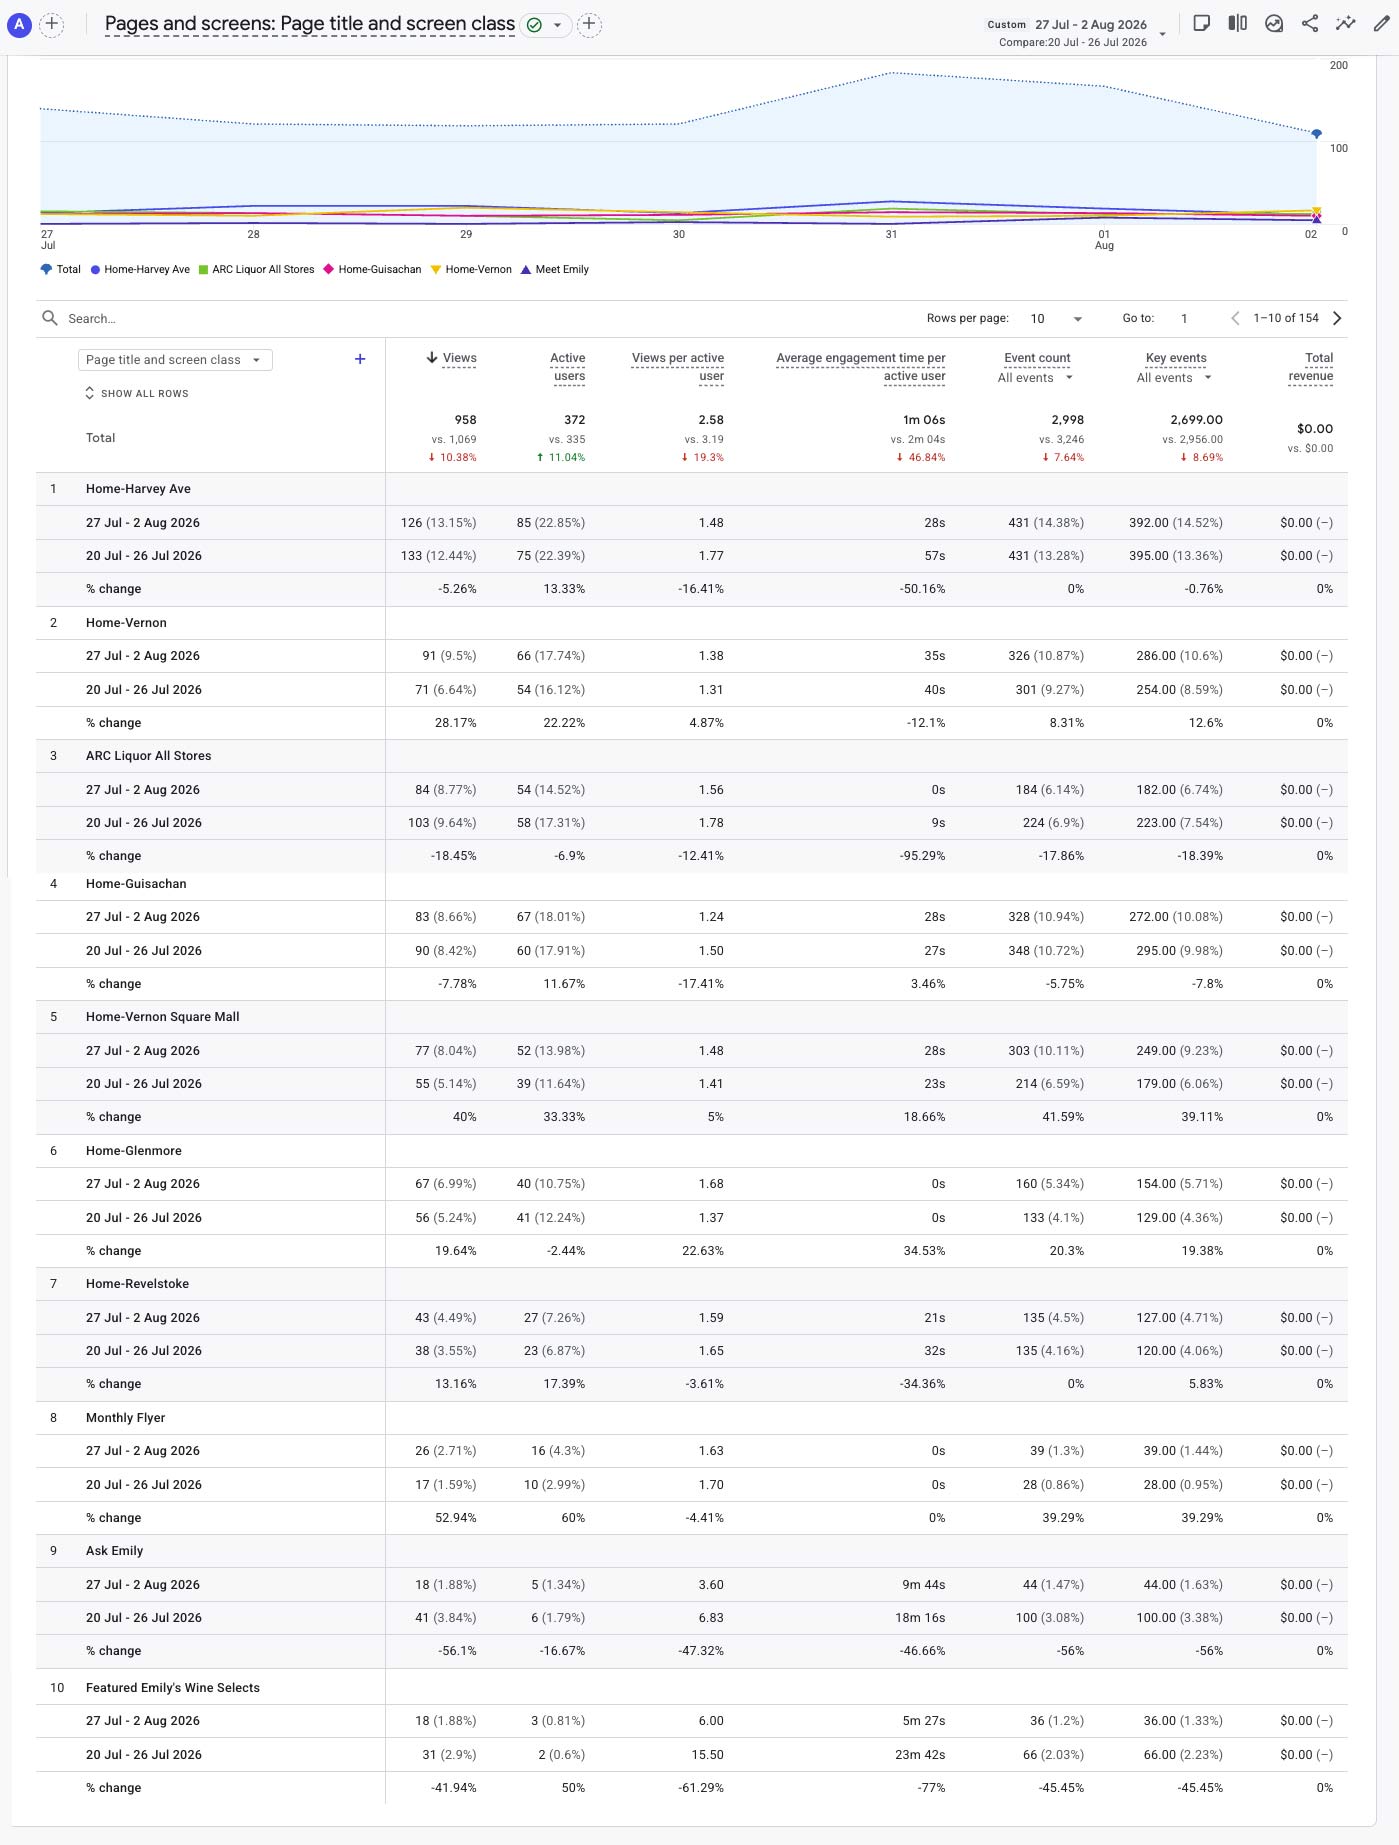
Harvey remained the most-viewed store homepage. Vernon, Vernon Square Mall, Glenmore and Revelstoke all recorded growth, while the ARC All Stores gateway and Emily pages softened compared with the previous week.
| Page | Views | WoW note |
|---|---|---|
| Home–Harvey Ave | 126 | ↓ 5.3% |
| Home–Vernon | 91 | ↑ 28.2% |
| ARC Liquor All Stores | 84 | ↓ 18.4% |
| Home–Guisachan | 83 | ↓ 7.8% |
| Home–Vernon Square Mall | 77 | ↑ 40.0% |
| Home–Glenmore | 67 | ↑ 19.6% |
| Home–Revelstoke | 43 | ↑ 13.2% |
| Monthly Flyer | 26 | ↑ 52.9% |
| Ask Emily | 18 | ↓ 56.1% |
| Featured Emily's Wine Selects | 18 | ↓ 41.9% |
The strongest store-level story was the growth outside Harvey. Vernon and Vernon Square Mall recorded substantial gains, while Glenmore and Revelstoke also improved. This supports ARC's broader objective of distributing attention across the full store network.
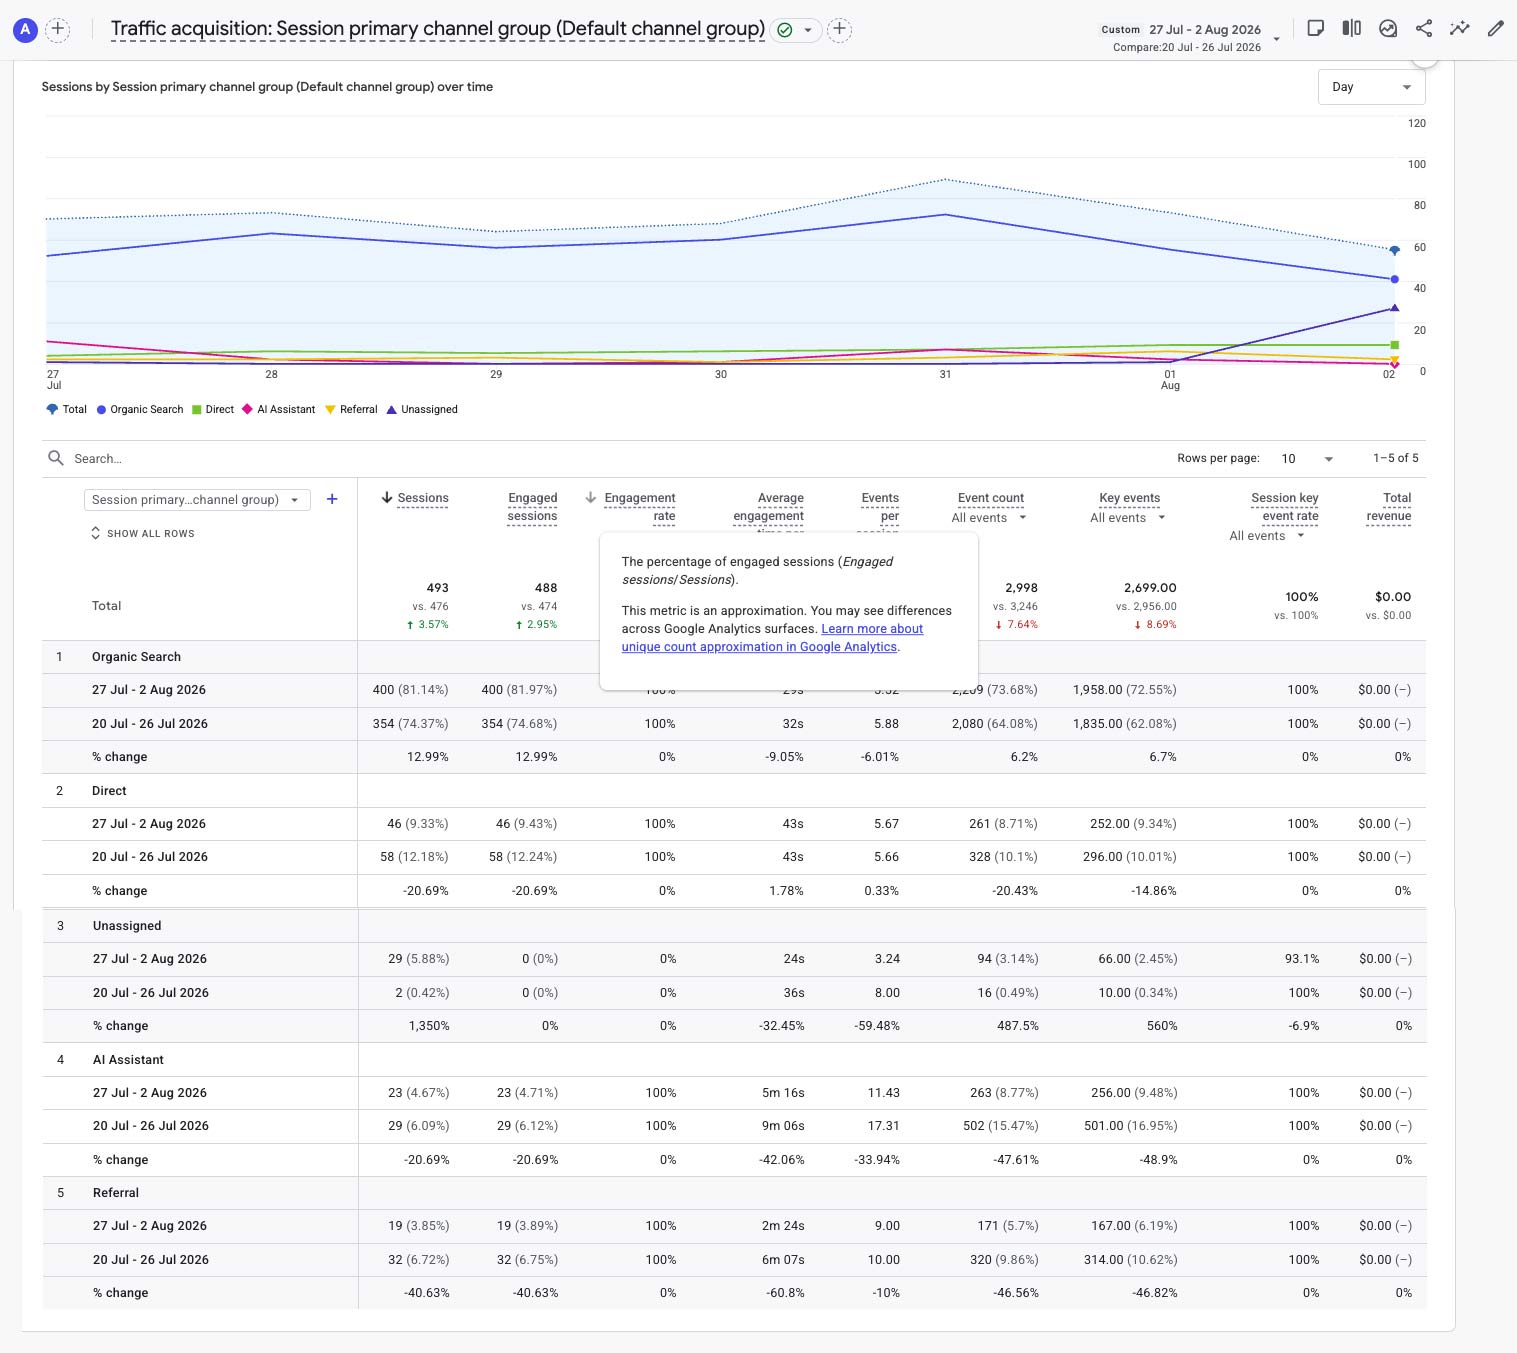
Sessions by primary channel
Organic Search was the decisive growth driver, increasing to 400 sessions and representing 81.1% of all visits. Direct, Referral and AI Assistant traffic declined. The sharp increase in Unassigned traffic is an attribution issue rather than a dependable acquisition gain and should be investigated.
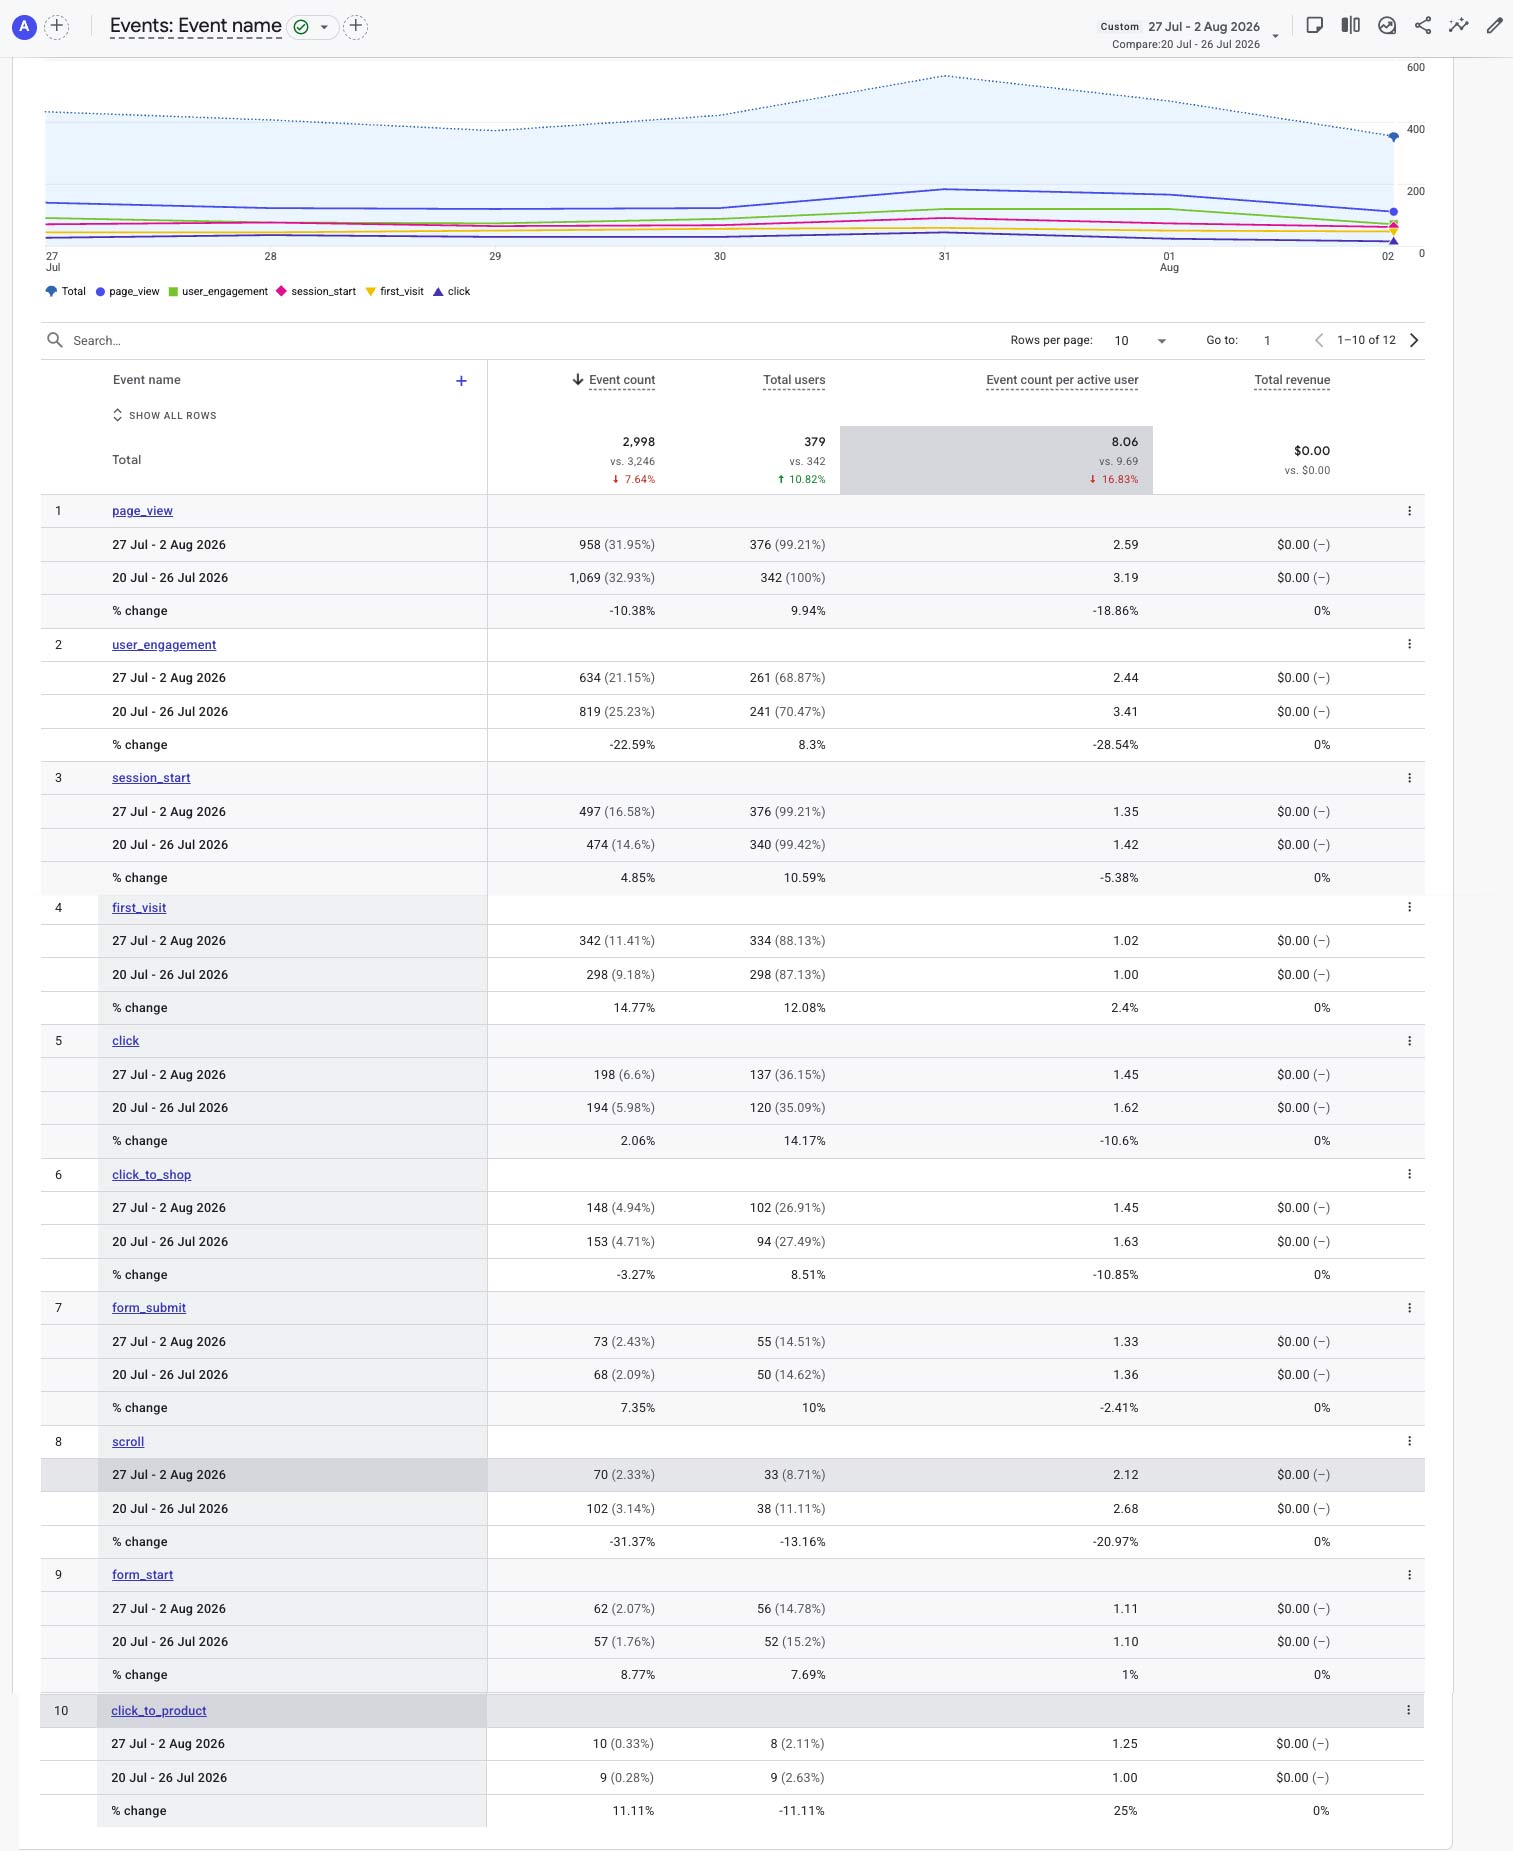
- page_view: 958 (↓ 10.4%)
- user_engagement: 634 (↓ 22.6%)
- session_start: 497 (↑ 4.9%)
- first_visit: 342 (↑ 14.8%)
- click: 198 (↑ 2.1%)
- click_to_shop: 148 (↓ 3.3%)
- form_submit: 73 (↑ 7.4%)
- scroll: 70 (↓ 31.4%)
- form_start: 62 (↑ 8.8%)
- click_to_product: 10 (↑ 11.1%)
ARC attracted more users and sessions, while clicks, forms and product actions improved. However, page views, scrolling and user-engagement events declined. Visitors completed useful actions, but explored fewer pages and generated fewer interactions per user.
Commercial actions
- click_to_shop: 148 (↓ 3.3%)
- click_to_product: 10 (↑ 11.1%)
- General clicks: 198 (↑ 2.1%)
- Form submissions: 73 (↑ 7.4%)
Click-to-Shop was nearly level despite lower page views and engagement depth. Product clicks, general clicks and form activity increased, showing that key customer actions held up better than overall content consumption.
Digital System Progress
The ARC digital platform continues to broaden its reach through Organic Search and store-specific discovery. The next priority is to connect future Emily promotions, social media activity and in-store QR campaigns with clear attribution so leadership can distinguish organic growth from campaign-driven visits.
✅ Central ARC brand gateway
✅ Six individual store experiences
✅ Store-specific Product Finders
✅ Conversational and Voice AI pathways
✅ Weekly acquisition and intent reporting- Build on Organic Search: continue local SEO and store-page optimization while search visibility is strengthening.
- Support growing stores: review the content and search pathways contributing to Vernon, Vernon Square Mall, Glenmore and Revelstoke growth.
- Improve attribution: investigate the increase in Unassigned traffic and apply consistent UTM tagging.
- Reintroduce Emily promotion: use Summer Selects, social content and the in-store display to generate new customer activity.
- Protect customer intent: keep Click-to-Shop, product clicks and form actions central to weekly reporting.
- Monitor engagement quality: determine whether the lower engagement time is temporary or part of a broader trend.
Week 20 delivered stronger reach and acquisition. Sessions increased to 493, active users increased to 372, and new users rose to 342. Organic Search was the principal driver with 400 sessions, while Vernon, Vernon Square Mall, Glenmore, Revelstoke and the Monthly Flyer recorded page growth. Engagement depth and total events declined, but clicks, forms and product actions improved, and Click-to-Shop remained broadly stable.
Week 20 showed that ARC can grow its audience through Organic Search while continuing to strengthen store-level discovery and meaningful customer actions.
You can view the graphs and read the full analysis in the PDF report.
Click to download this reportGA4 Glossary (quick reference)
A quick guide to the core metrics used in this report.
Active users
Unique people who actively visited during the reporting window.
New users
First-time visitors in the reporting window.
Sessions
Total visits. One person can generate multiple sessions.
Engaged sessions
Sessions where the visitor showed meaningful engagement.
Event count
Total tracked interactions, including views, clicks, scrolls, forms and shopping actions.
Key events
Events marked as important in GA4 for conversion-style reporting.
Intent Tracking (ARC → Barnet)
click_to_shop
Outbound click from ARC into a store's Barnet shopping site.
click_to_product
Outbound click to a specific Barnet product page.
click_to_call
Tap or click on a store phone number.