Week 20: Website Performance
ARC Digital Scorecard
Overall website health remains positive. This is an analytical summary rather than a native GA4 metric.
| Area | Status | Assessment |
|---|---|---|
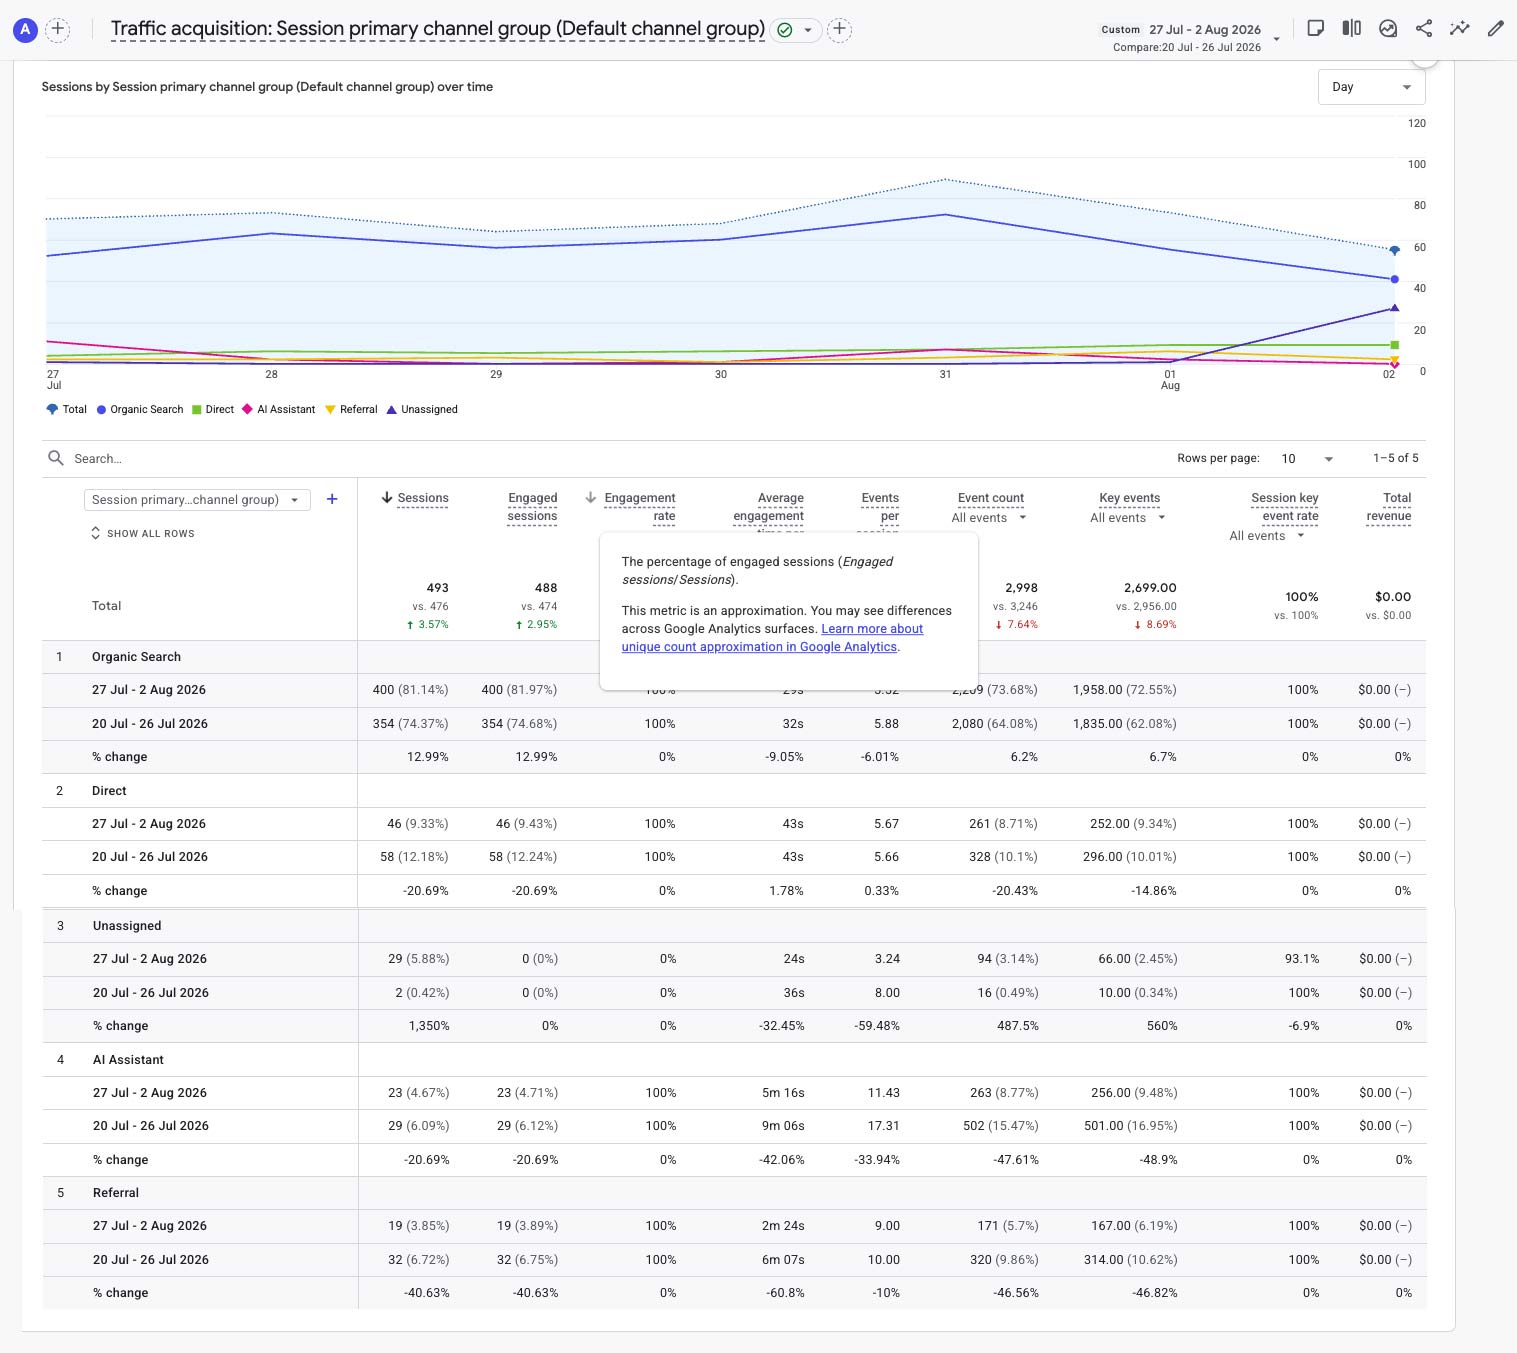
| SEO Momentum | Excellent | Organic Search increased to 400 sessions and supplied 81.1% of total traffic. |
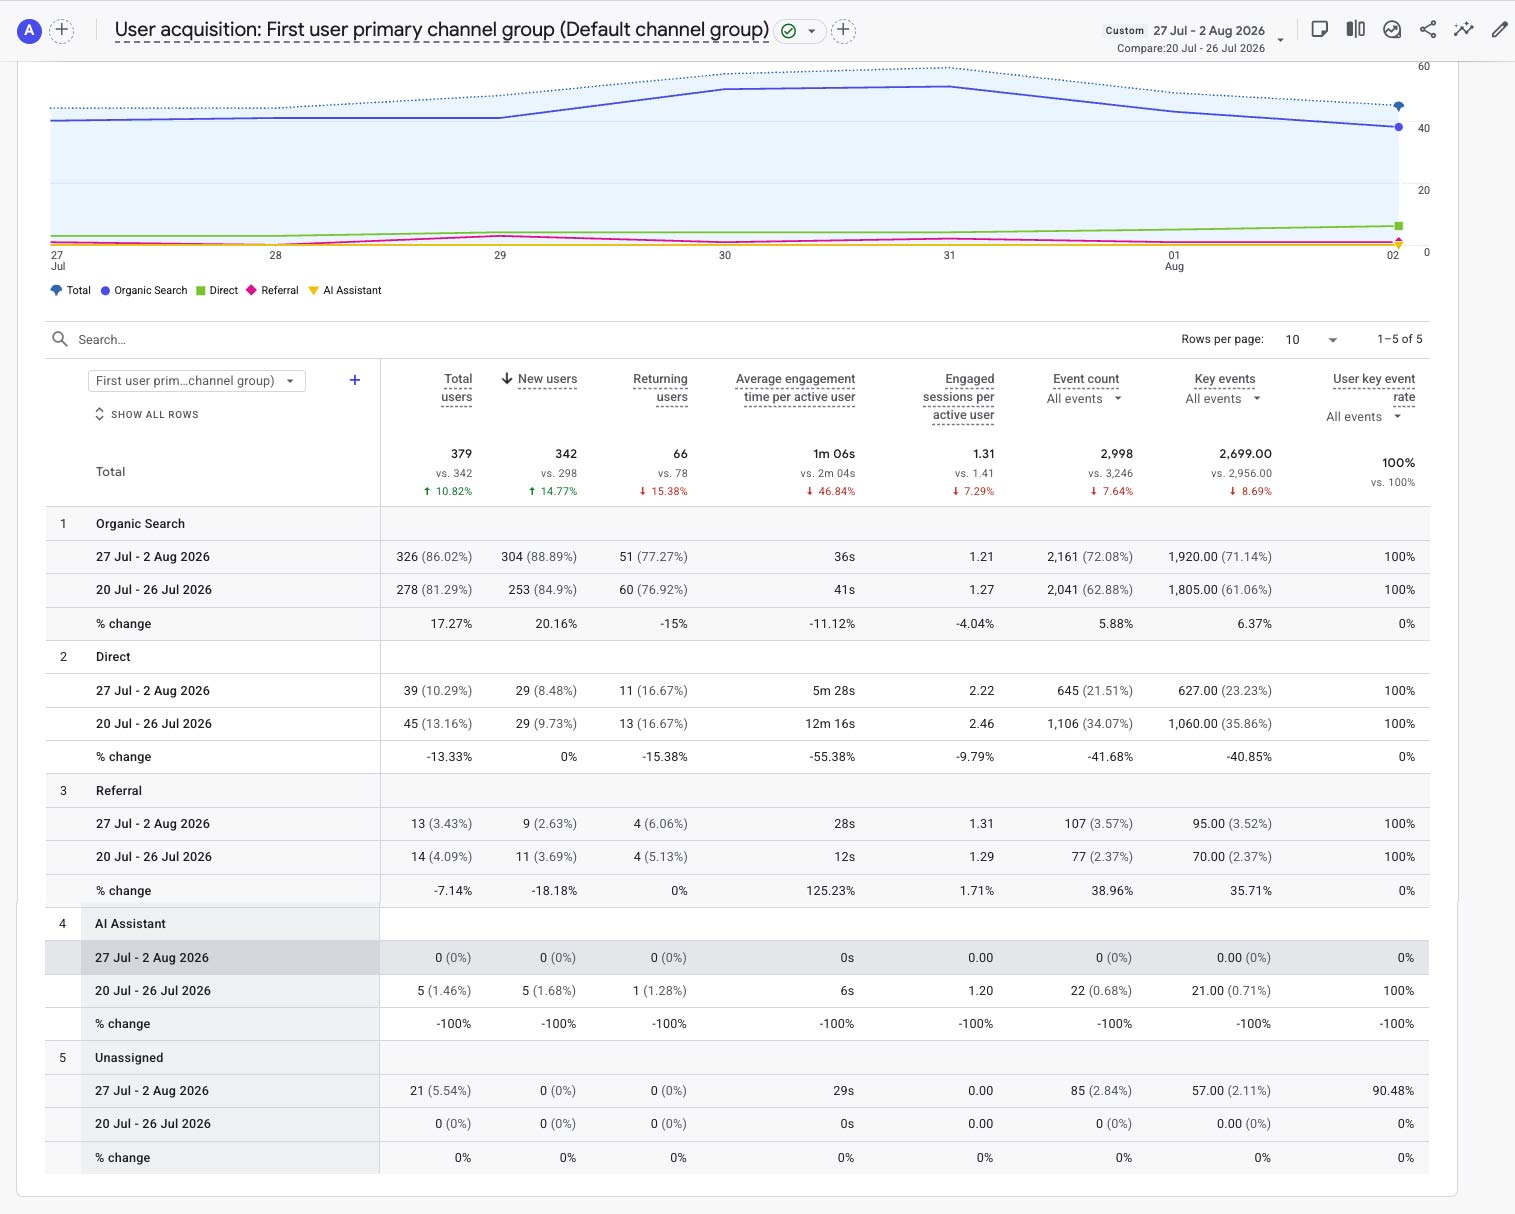
| Audience Growth | Strong | Active Users increased 11.0% and New Users increased 14.8%. |
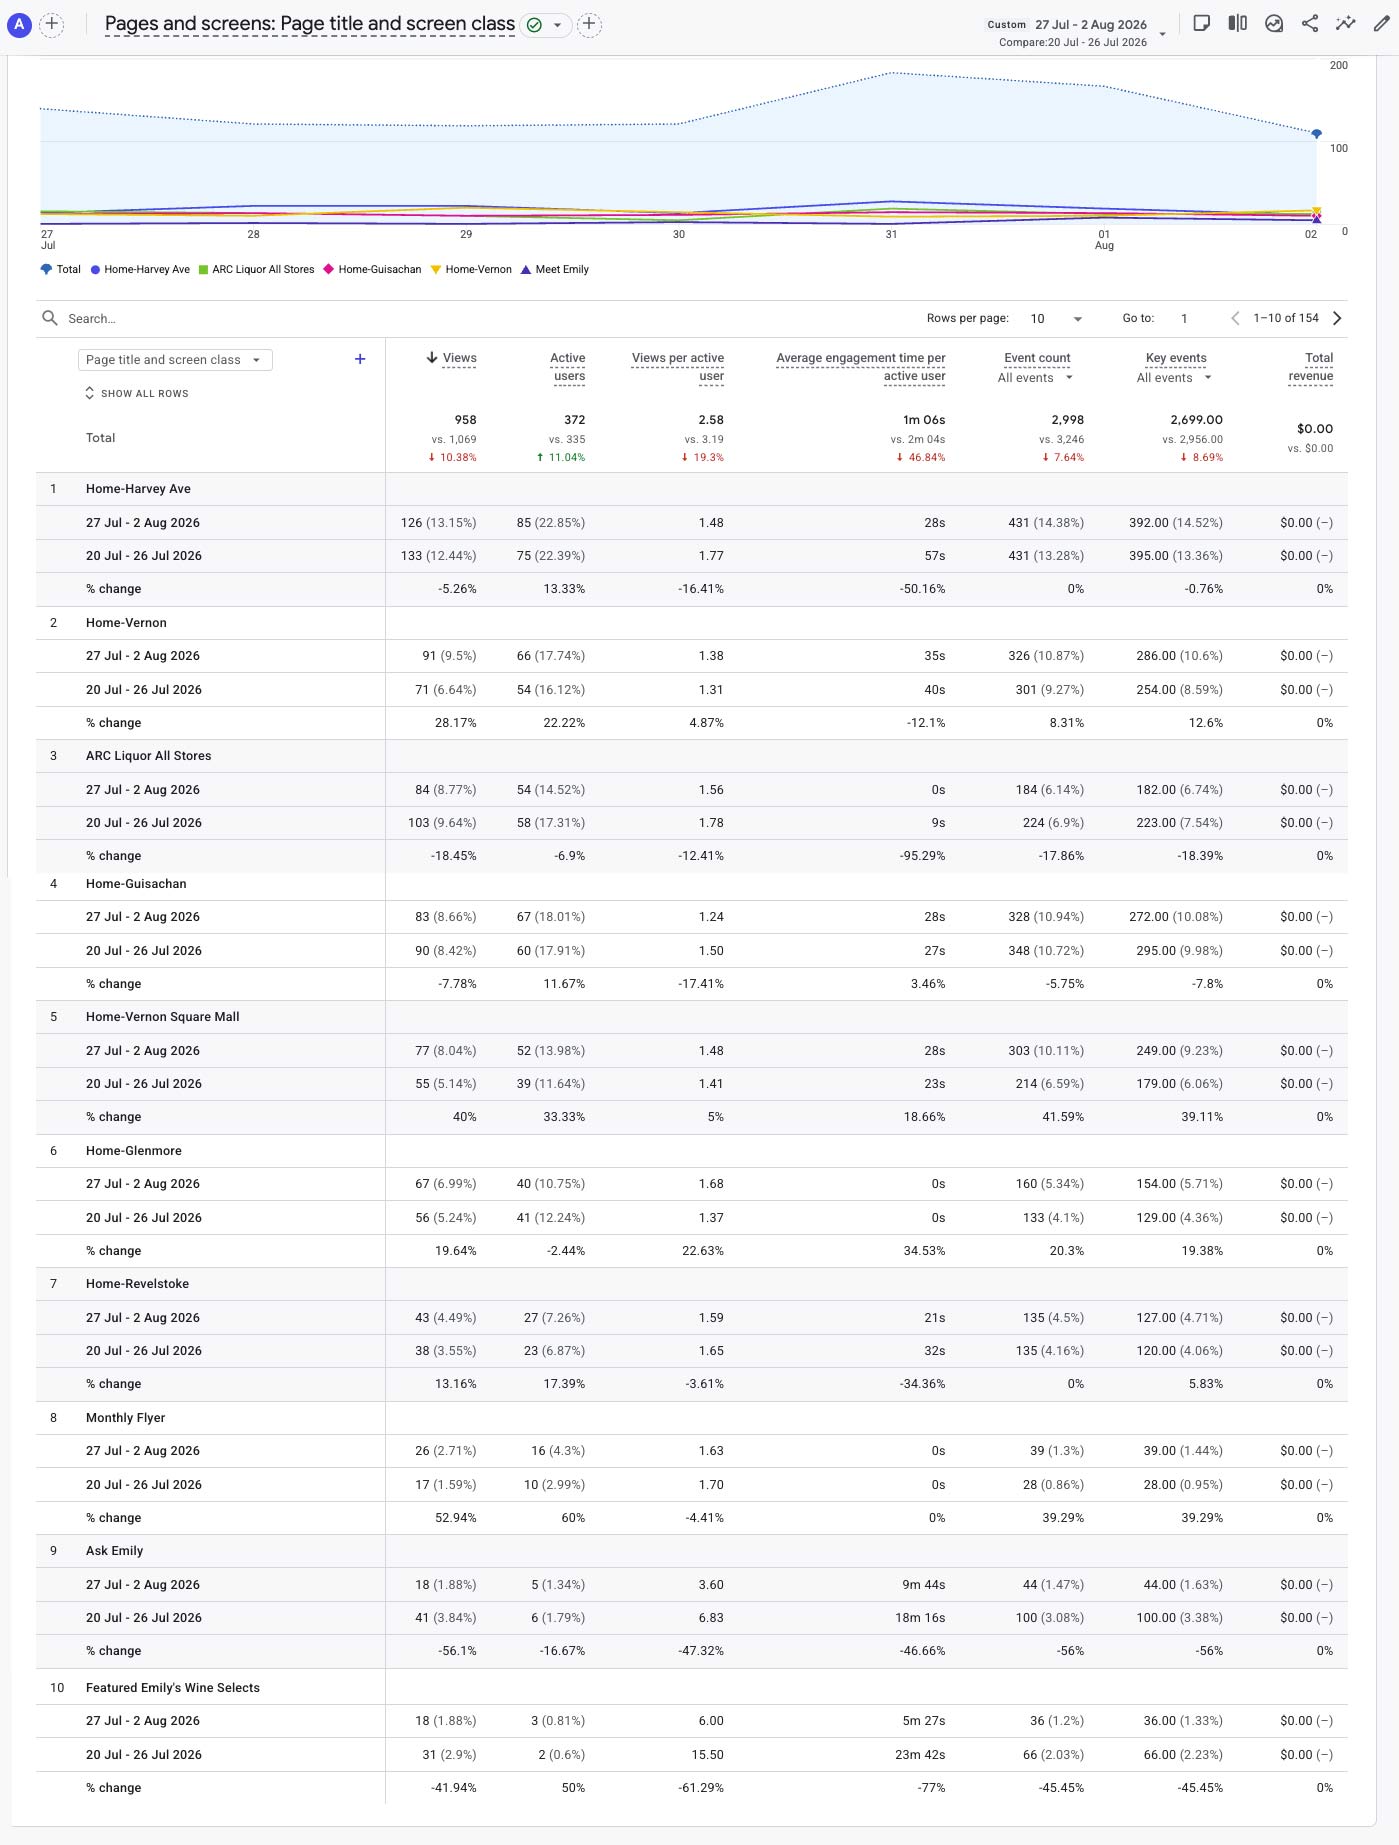
| Store Visibility | Improving | Vernon, Vernon Square Mall, Glenmore and Revelstoke all increased. |
| Customer Intent | Stable | Click-to-Shop remained resilient at 148, down only 3.3%. |
| Engagement Depth | Watch | Average engagement time declined to 1m 06s. |
Weekly Wins
- Organic Search increased to 400 sessions, up 13.0%.
- Active Users increased to 372, up 11.0%.
- New Users increased to 342, up 14.8%.
- Sessions increased to 493, up 3.6%.
- Home-Vernon increased 28.2%.
- Vernon Square Mall increased 40.0%.
- Monthly Flyer views increased 52.9%.
Watch List
- Average engagement time declined 46.8%.
- Page views declined 10.4%.
- User engagement events declined 22.6%.
- Meet Emily and Summer Selects normalized after launch activity.
- Unassigned traffic increased and requires attribution review.
Digital Milestone: Organic Search Expands ARC's Reach
Organic Search increased to 400 sessions, up 13.0%, and accounted for 81.1% of all website sessions. This is the clearest sign that ARC's growing network of store pages, editorial content and AI-supported experiences is improving discoverability.
Leadership interpretation: ARC attracted more users and more first-time visitors without relying on paid advertising. That provides a strong organic foundation for future campaigns promoting Emily's Summer Selects, member communications and targeted digital advertising.
The opportunity now is to preserve this reach while improving engagement depth and moving more visitors into tracked shopping actions.
Performance Overview
Week 20 delivered stronger reach and acquisition. Sessions, engaged sessions, active users and new users all increased. The softer side of the report was engagement depth: page views, event count and average engagement time declined.
What this means: ARC reached a larger audience, particularly through Organic Search, but visitors completed fewer interactions per person. The next priority is converting this renewed reach into deeper content exploration and shopping activity.
| Metric | This Week | Previous | Change |
|---|---|---|---|
| Sessions | 493 | 476 | +3.6% |
| Engaged Sessions | 488 | 474 | +3.0% |
| Active Users | 372 | 335 | +11.0% |
| New Users | 342 | 298 | +14.8% |
| Page Views | 958 | 1,069 | -10.4% |
| Average Engagement Time | 1m 06s | 2m 04s | -46.8% |
| Event Count | 2,998 | 3,246 | -7.6% |
| Click-to-Shop | 148 | 153 | -3.3% |
Traffic Acquisition
| Channel | Sessions | Previous | Change | Interpretation |
|---|---|---|---|---|
| Organic Search | 400 | 354 | +13.0% | ARC's strongest source, supplying 81.1% of sessions. |
| Direct | 46 | 58 | -20.7% | Continued softness in direct visits. |
| Unassigned | 29 | 2 | +1,350% | Requires review of campaign and source attribution. |
| AI Assistant | 23 | 29 | -20.7% | Remains a meaningful emerging source. |
| Referral | 19 | 32 | -40.6% | Normalized after earlier referral growth. |
Store and Content Performance
| Page | Views | Change |
|---|---|---|
| Home - Harvey Ave | 126 | -5.3% |
| Home - Vernon | 91 | +28.2% |
| ARC Liquor All Stores | 84 | -18.4% |
| Home - Guisachan | 83 | -7.8% |
| Home - Vernon Square Mall | 77 | +40.0% |
| Home - Glenmore | 67 | +19.6% |
| Home - Revelstoke | 43 | +13.2% |
| Monthly Flyer | 26 | +52.9% |
| Ask Emily | 18 | -56.1% |
| Featured Emily's Wine Selects | 18 | -41.9% |
Interpretation
Harvey remained the leading store page, while Vernon, Vernon Square Mall, Glenmore and Revelstoke all recorded growth. This broader store-page improvement supports ARC's objective of distributing attention more evenly across the store network.
Emily-related pages declined after their launch period. This should be treated as normalization rather than failure. The next growth opportunity is to actively promote Emily's Summer Selects through social media, member outreach and the planned in-store display.
Events and Customer Actions
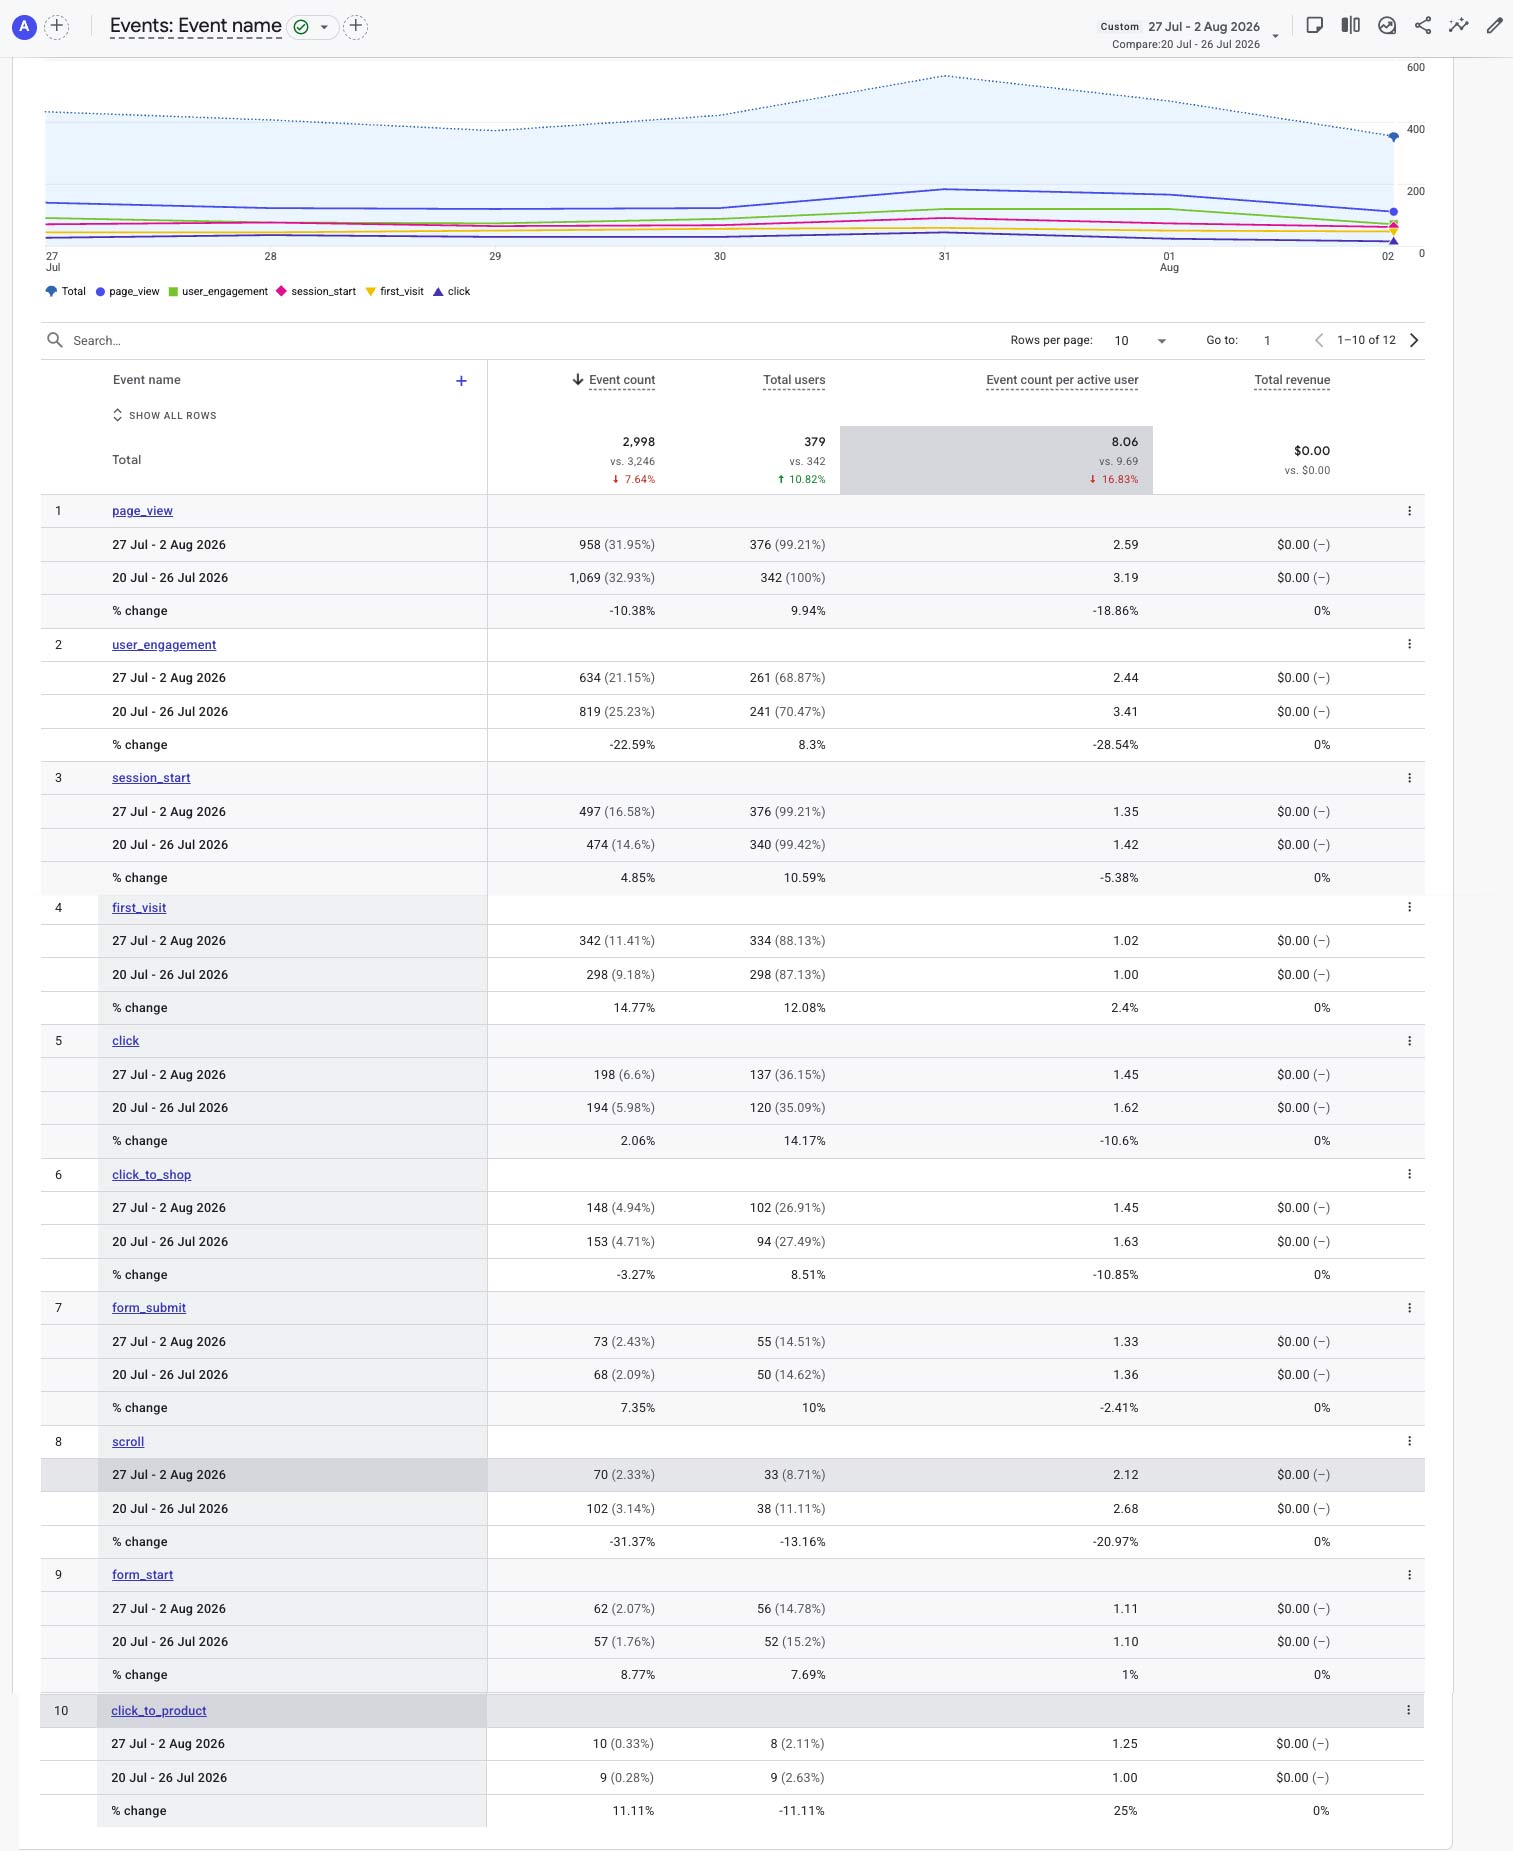
| Event | Count | Change |
|---|---|---|
| page_view | 958 | -10.4% |
| user_engagement | 634 | -22.6% |
| session_start | 497 | +4.9% |
| first_visit | 342 | +14.8% |
| click | 198 | +2.1% |
| click_to_shop | 148 | -3.3% |
| form_submit | 73 | +7.4% |
| scroll | 70 | -31.4% |
| form_start | 62 | +8.8% |
| click_to_product | 10 | +11.1% |
Efficiency insight: first visits, general clicks, form starts, form submissions and product clicks all improved. Click-to-Shop remained almost level despite the decline in page views, indicating that purchase intent remained comparatively resilient.
AI & Digital Tools Update
ARC's digital ecosystem continues to combine the all-store gateway, six store websites, Product Finders, conversational AI, Voice AI and the developing Emily brand experience.
AI Assistant traffic delivered 23 sessions with an average engagement time of 5m 16s. Although volume declined from the previous week, AI remains a measurable and highly engaged acquisition source.
Recommended Actions
- Build on Organic Search growth through continued local SEO and store-level content.
- Promote Emily's Summer Selects through social media, member communications and the Harvey in-store display.
- Add UTM tracking to Emily CTAs, campaign links and QR codes.
- Review Unassigned traffic and campaign attribution.
- Improve internal pathways from store pages into Product Finder and Click-to-Shop actions.
- Monitor engagement depth alongside audience growth over the next three weeks.
Trend Tracker
| Trend | Status | Why |
|---|---|---|
| Organic Search | Excellent | 400 sessions, up 13.0%, representing 81.1% of traffic. |
| Audience Reach | Growing | Active Users and New Users both increased strongly. |
| Store Network | Improving | Four store pages recorded double-digit growth. |
| Forms and Product Clicks | Improving | Form starts, submissions and product clicks increased. |
| Engagement Depth | Watch | Average engagement time and scrolling declined. |
| Attribution Quality | Review | 29 sessions were classified as Unassigned. |
Supporting GA4 Reports
These images follow the numbered GA4 sequence and descriptive naming standard established for the weekly reporting package.