
ARC Liquor Stores
Weekly Reporting • GA4 + Intent Tracking
Weekly Performance Report
A weekly leadership snapshot covering traffic, engagement, store-page performance, acquisition channels and customer-intent actions across ARC's connected digital platform.
Alongside the established Gold Standard report, an enhanced leadership layout is available with a visual scorecard, trend tracker and expanded interpretation.
Leadership takeaway (Week 26)
Week 26 normalized after Week 25's exceptional rebound. ARC recorded 374 sessions (▼23.7%), 371 engaged sessions (▼24.1%), 273 active users (▼27.8%) and 238 new users (▼31.6%). Page views were more resilient at 882 (▼9.8%).
The positive story is customer intent and AI-assisted engagement. Click-to-Shop increased to 132 (▲3.9%) despite the smaller audience. AI Assistant traffic increased to 39 sessions (▲85.7%), with 7m 09s average engagement per session, 18.82 events per session and 725 key events.
Traffic volume softened, but commercial intent did not follow it down. ARC generated more Click-to-Shop actions from fewer sessions, while AI Assistant became a materially stronger and exceptionally engaged acquisition channel. That combination is the most important Week 26 signal.
Weekly wins
- Click-to-Shop: increased to 132 (▲3.9%) despite sessions falling 23.7%.
- AI Assistant: increased to 39 sessions (▲85.7%).
- AI Assistant engagement: 7m 09s per session (▲33.0%) and 18.82 events/session (▲19.1%).
- Harvey Avenue: increased to 148 views (▲4.2%).
- Emily ecosystem: Emily 94 views, Ask Emily 32, Emily Selects 22, and the new Emily Voice AI demo 20.
- Click-to-Call: 7 tracked actions appeared this week.
Watch list
- Organic Search: 256 sessions (▼25.8%).
- New users: 238 (▼31.6%).
- Average engagement: 1m 34s (▼64.1%) after Week 25's unusually high result.
- Forms: submissions 39 (▼13.3%) and starts 31 (▼22.5%).
- Unassigned: increased to 22 sessions and requires attribution review.
PDF report download
The PDF contains the complete Week 26 analysis, supporting GA4 screenshots, acquisition data, store-page performance, event tracking and recommended actions.
Sessions: 374 • AI Assistant: 39 • Click-to-Shop: 132 • Page Views: 882| Metric | Week 26 | WoW change |
|---|---|---|
| Sessions | 374 | ▼ 23.7% |
| Engaged Sessions | 371 | ▼ 24.1% |
| Active Users | 273 | ▼ 27.8% |
| New Users | 238 | ▼ 31.6% |
| Page Views | 882 | ▼ 9.8% |
| Avg Engagement | 1m 34s | ▼ 64.1% |
| Total Events | 2,642 | ▼ 13.7% |
| Key Events | 2,424 | ▼ 14.4% |
| Click-to-Shop | 132 | ▲ 3.9% |
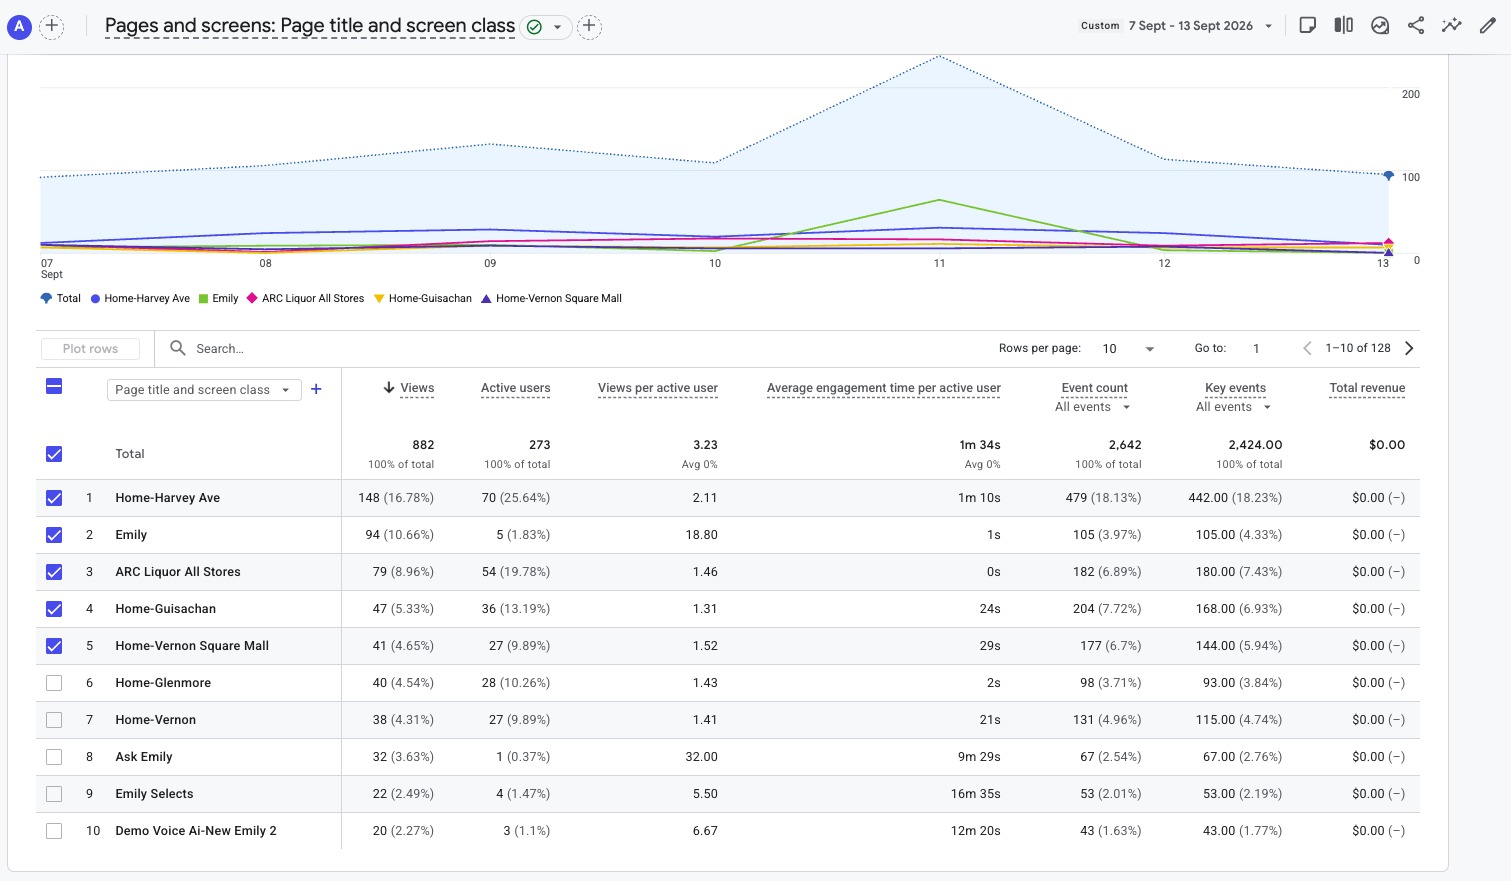
Store traffic was mixed. Harvey Avenue increased and the All Stores page held steady, while several other store pages softened. The most notable content development was the expanded Emily footprint across the Top 10.
| Page | Views | WoW note |
|---|---|---|
| Home-Harvey Ave | 148 | ▲ 4.2% |
| Emily | 94 | ▲ 4,600.0% |
| ARC Liquor All Stores | 79 | 0.0% |
| Home-Guisachan | 47 | ▼ 29.9% |
| Home-Vernon Square Mall | 41 | ▼ 22.6% |
| Home-Glenmore | 40 | ▼ 43.7% |
| Home-Vernon | 38 | ▼ 50.0% |
| Ask Emily | 32 | Emerging |
| Emily Selects | 22 | Continuing |
| Demo Voice AI-New Emily 2 | 20 | Development/demo |
The page titled Emily recorded 94 views from only five active users, so the 4,600% increase should not be treated as broad customer growth. Ask Emily, Emily Selects and the new Voice AI demo also appear in the Top 10. Given active development and testing, these figures are best treated as evidence of growing Emily activity and an evolving baseline rather than clean customer-demand measures.
| Channel | Sessions | WoW note |
|---|---|---|
| Organic Search | 256 | ▼ 25.8% |
| Direct | 61 | ▼ 40.8% |
| AI Assistant | 39 | ▲ 85.7% |
| Unassigned | 22 | ▲ from 1 |
| Referral | 9 | ▼ 52.6% |
| Cross-network | 5 | New |
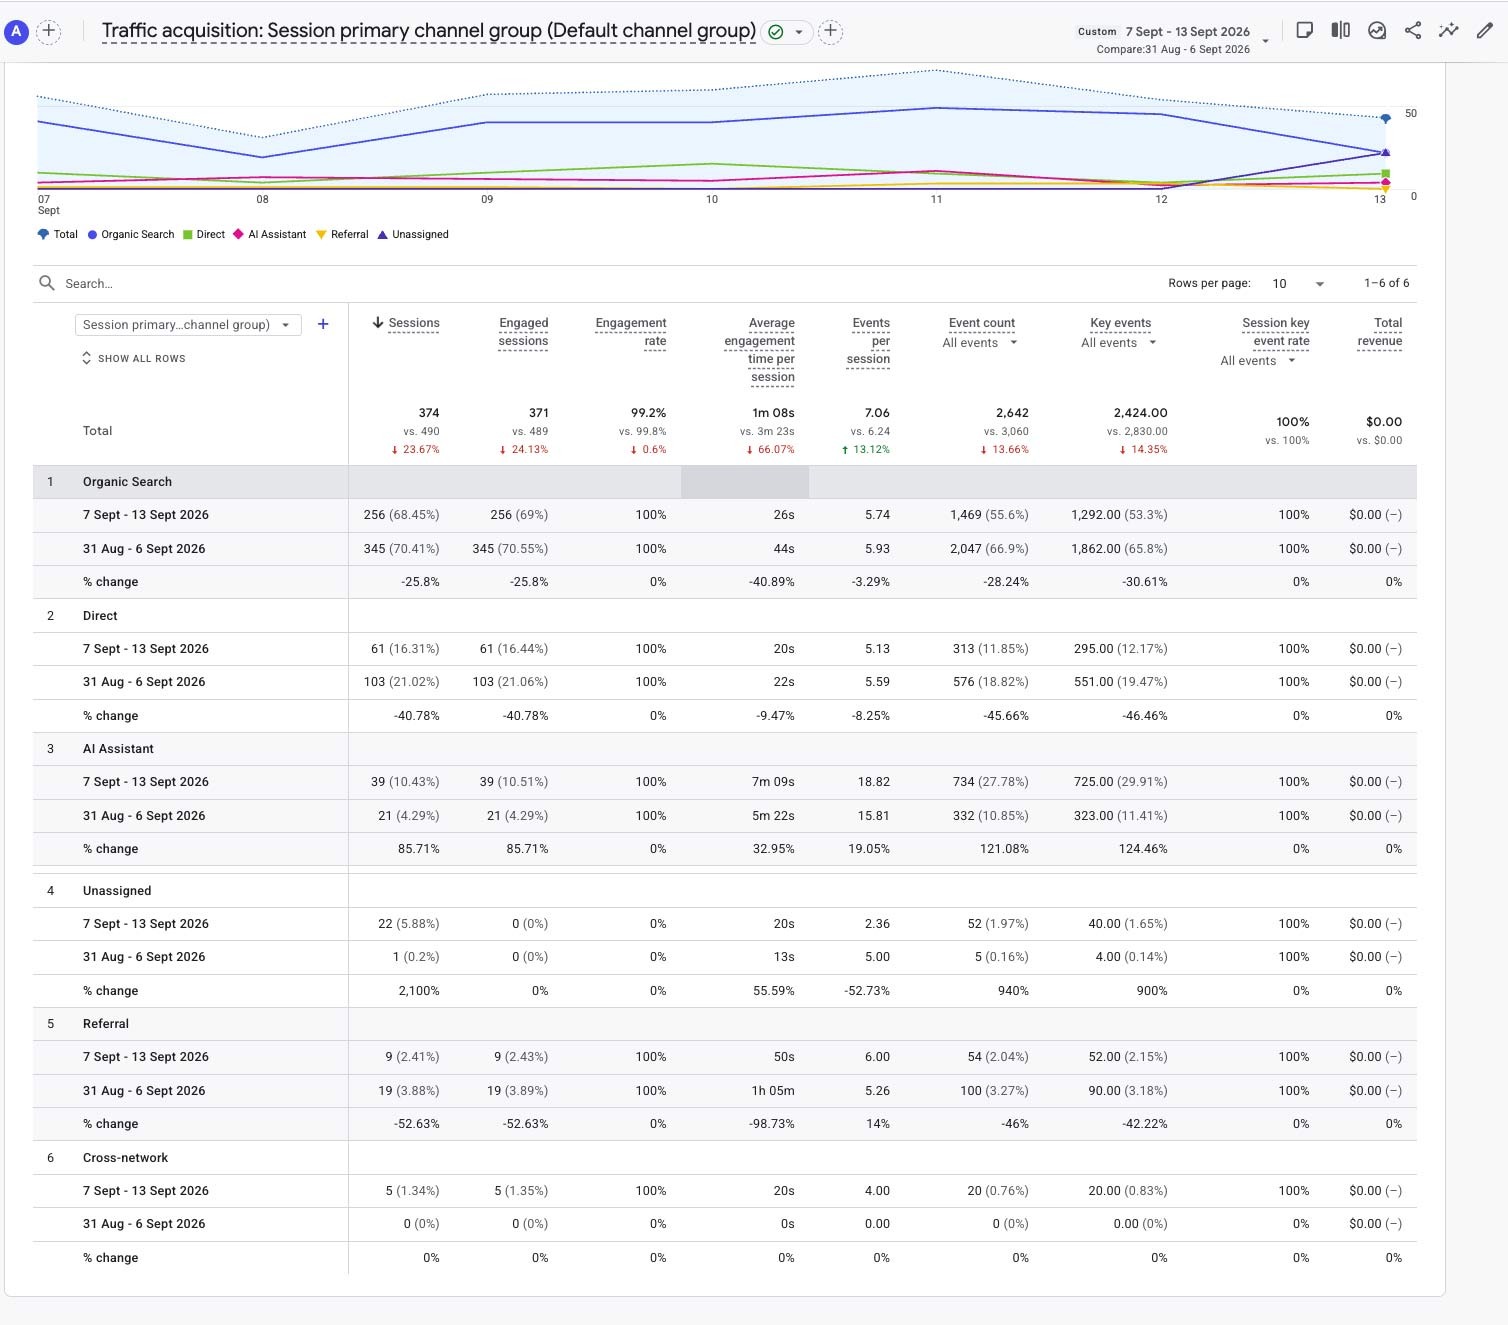
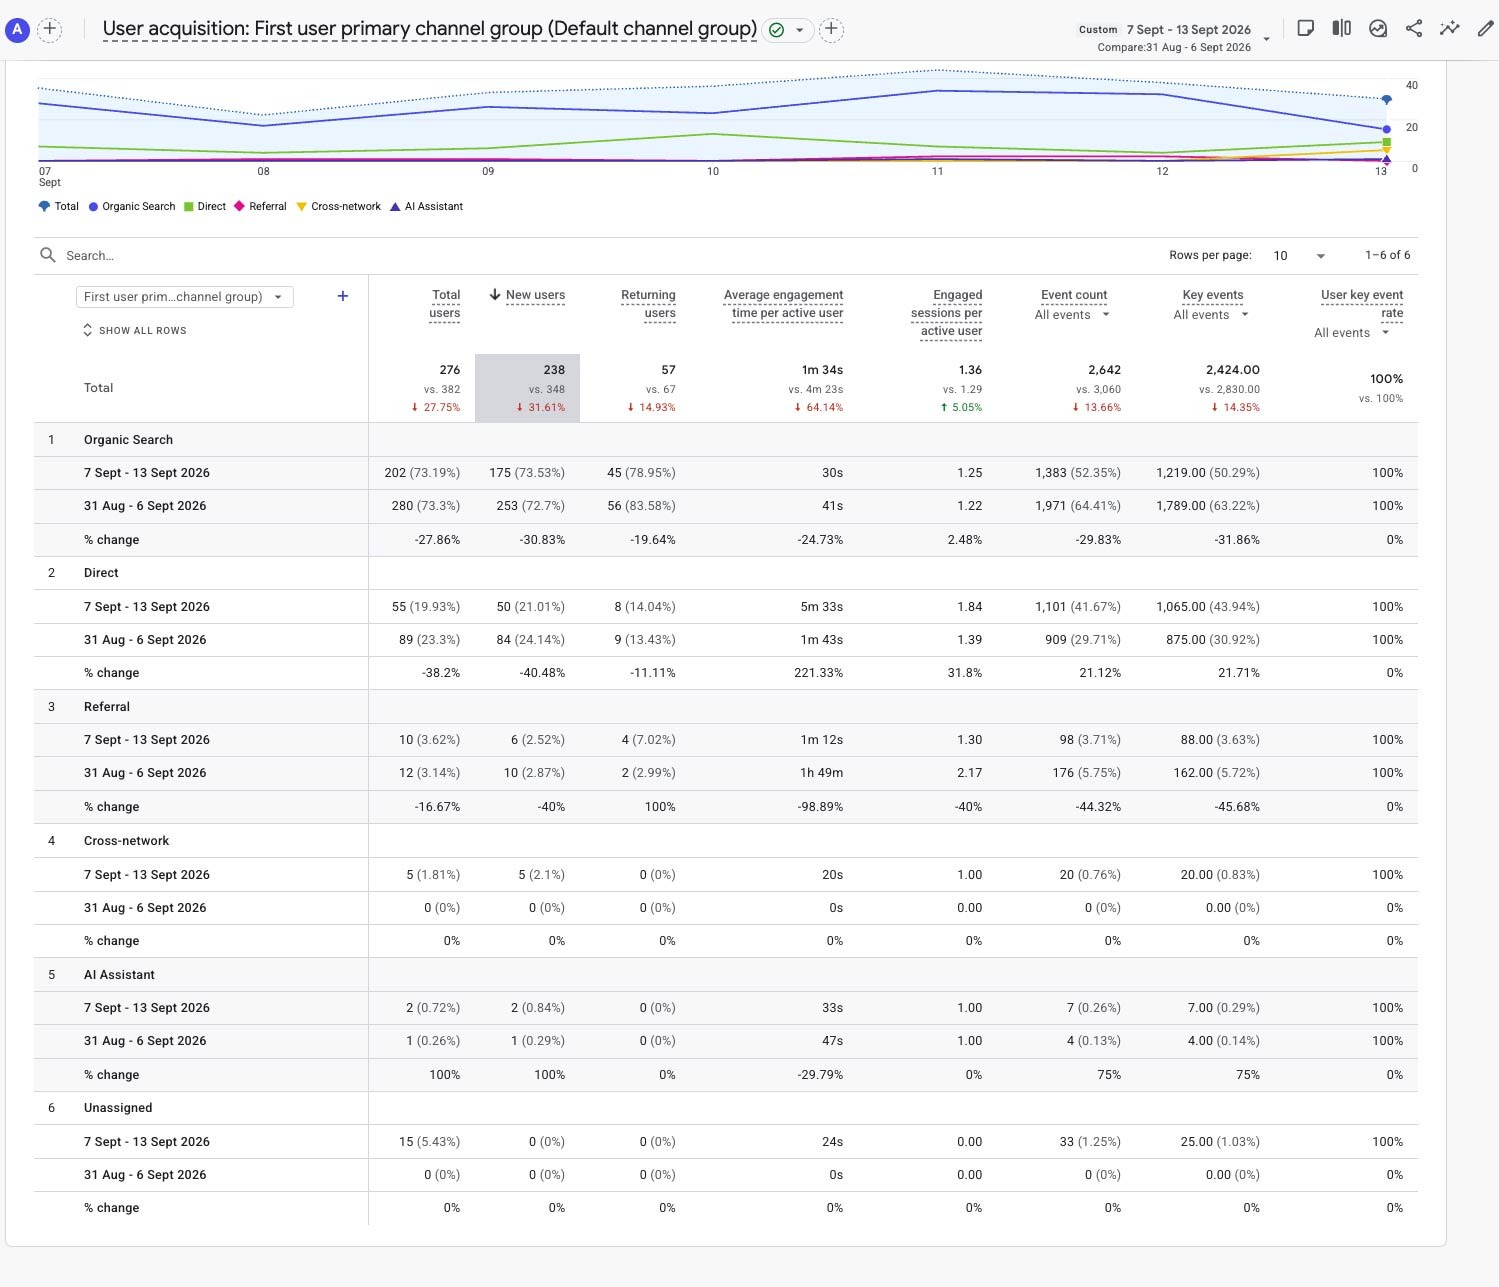
Organic Search remains ARC's foundation but softened after Week 25. The standout is AI Assistant: 39 sessions represented 10.43% of all sessions, with 7m 09s average engagement, 18.82 events per session and 725 key events. This is still a developing channel, but it is now large enough to merit close weekly attention.
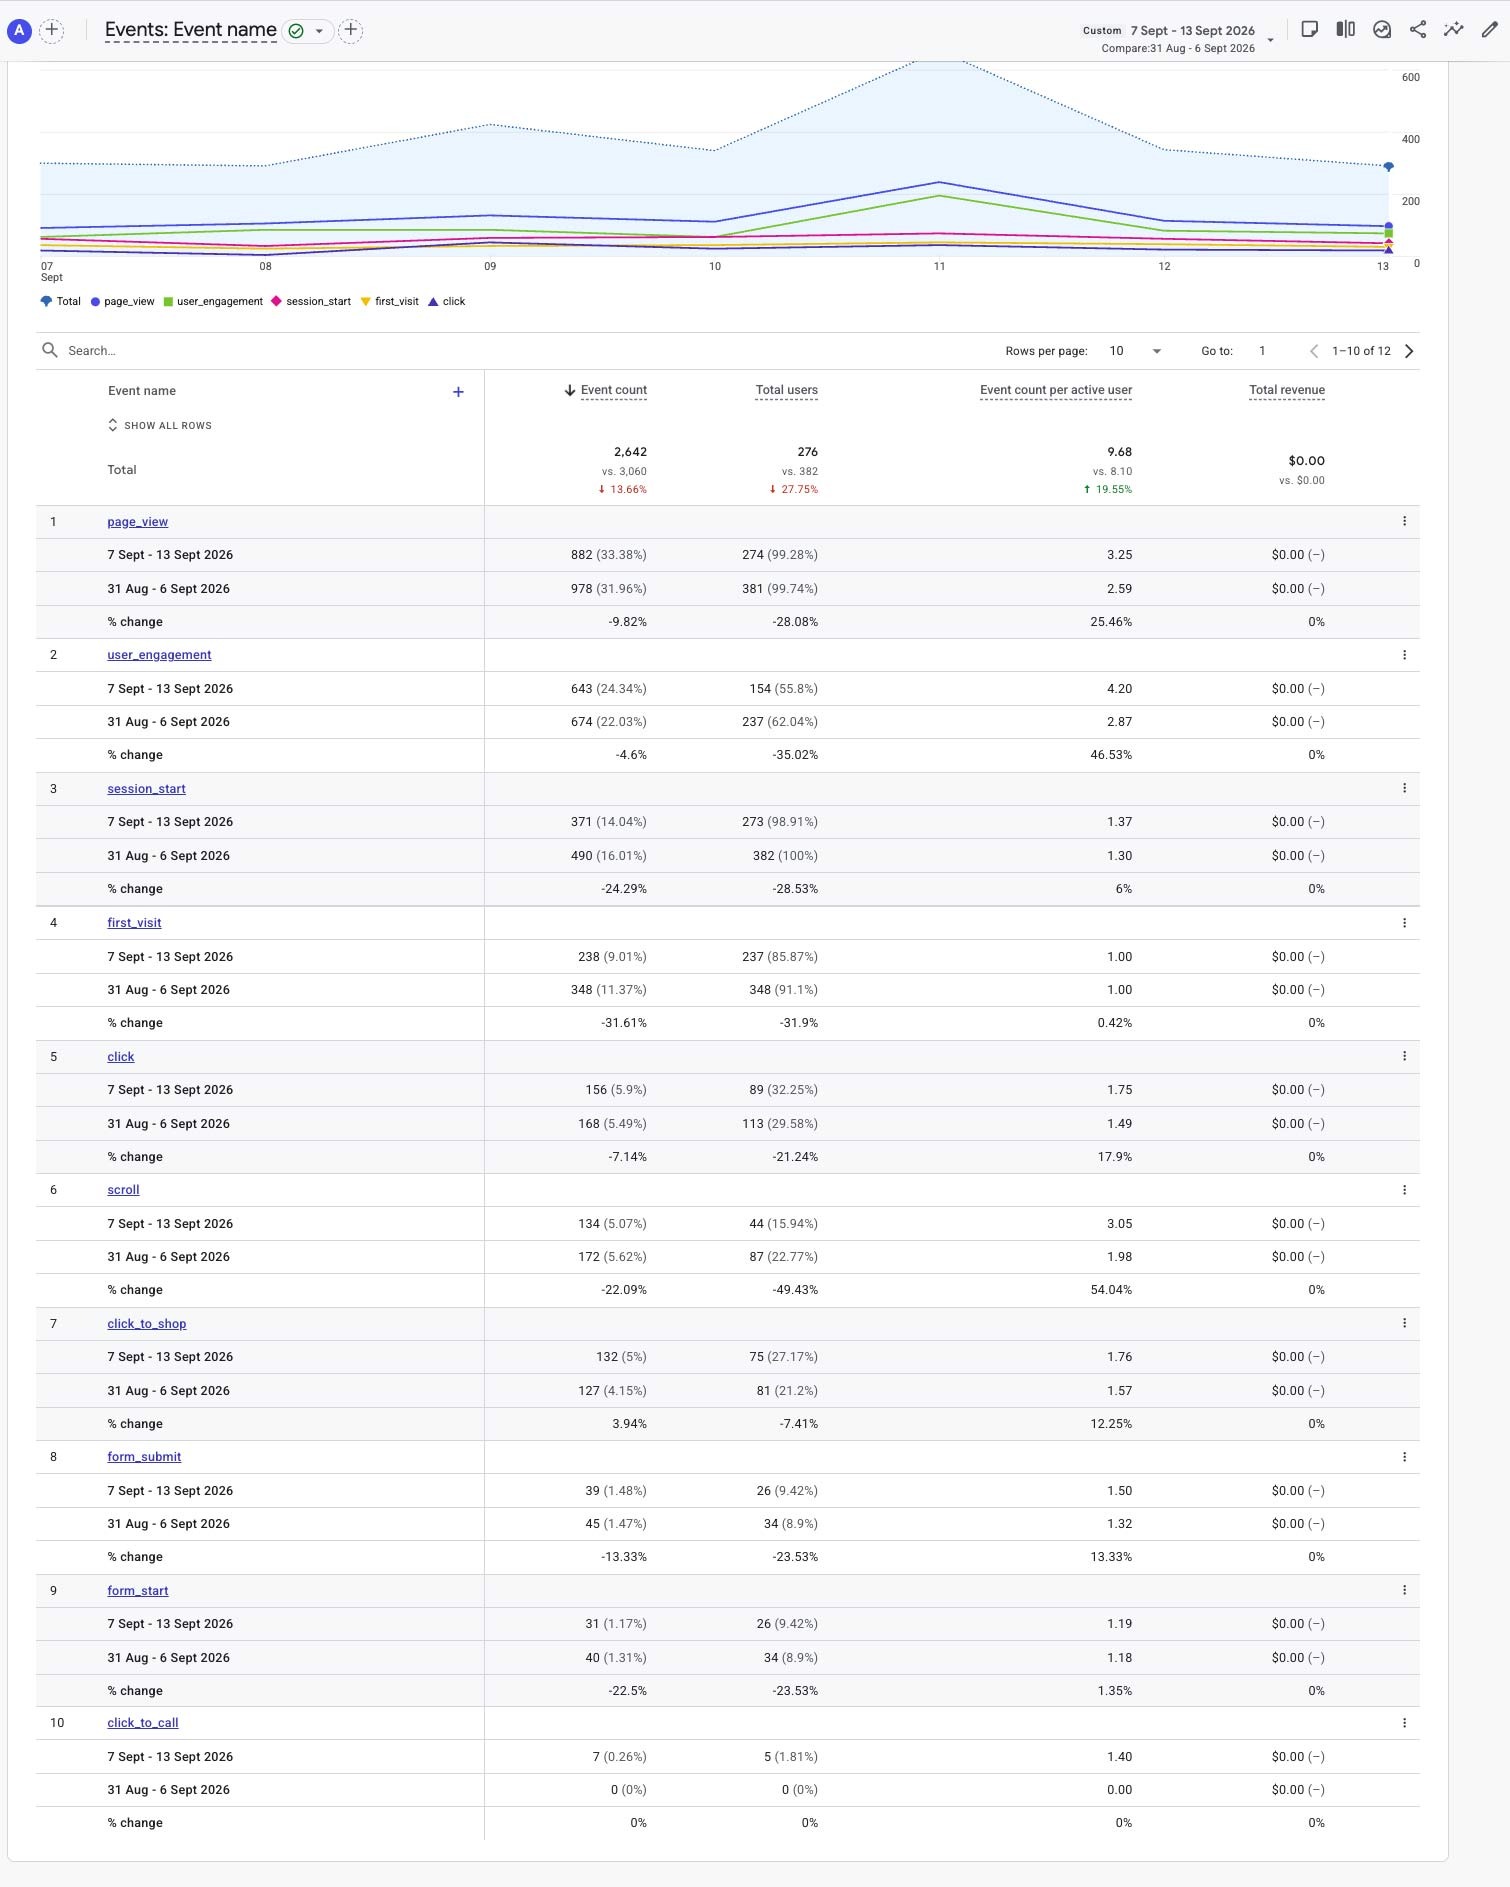
| Event | Week 26 | WoW change |
|---|---|---|
| page_view | 882 | ▼ 9.8% |
| user_engagement | 643 | ▼ 4.6% |
| session_start | 371 | ▼ 24.3% |
| first_visit | 238 | ▼ 31.6% |
| click | 156 | ▼ 7.1% |
| scroll | 134 | ▼ 22.1% |
| click_to_shop | 132 | ▲ 3.9% |
| form_submit | 39 | ▼ 13.3% |
| form_start | 31 | ▼ 22.5% |
| click_to_call | 7 | New |
Most volume events declined with the smaller audience, but the declines were generally shallower than the fall in sessions. Click-to-Shop moved in the opposite direction, increasing to 132. This is the clearest evidence that Week 26's smaller audience remained commercially purposeful.
Click-to-Shop: 132 actions, up 3.9%. Total clicks: 156, down 7.1%. Form submissions: 39, down 13.3%. Form starts: 31, down 22.5%. Click-to-Call: 7 actions.
Click-to-Shop rose while sessions fell from 490 to 374. As a simple directional measure, Click-to-Shop actions equalled roughly 35.3% of sessions, compared with about 25.9% in Week 25. This is not a GA4 conversion rate, but it reinforces the stronger-action-density story.
- AI Assistant: investigate the drivers behind the 85.7% session growth and exceptional engagement quality.
- Organic Search: review the 25.8% decline and identify whether Week 25 was an exceptional spike or Week 26 reflects a broader softness.
- Emily measurement: separate development/testing activity from customer behaviour wherever practical as the new experience rolls out.
- Customer intent: protect the stronger Click-to-Shop action density and understand which journeys are producing it.
- Forms: review the continued decline in starts and submissions.
- Attribution: investigate the return of 22 Unassigned sessions.
Week 26 was a normalization week after Week 25's exceptional audience rebound, but it contained two highly encouraging signals. Click-to-Shop increased despite materially fewer sessions, and AI Assistant traffic nearly doubled while delivering exceptional engagement. Organic Search and new-user acquisition require attention, but the quality of AI-assisted traffic and resilience of shopping intent give leadership something substantial to build on.
Week 26 brought fewer visitors, but stronger action density - Click-to-Shop increased while AI Assistant traffic nearly doubled and became ARC's most engaged acquisition channel.
You can view the graphs and read the full analysis in the PDF report.
Click to download this reportGA4 Glossary (quick reference)
A quick guide to the core metrics used in this report.
Active users
Unique people who actively visited during the reporting window.
New users
First-time visitors in the reporting window.
Sessions
Total visits. One person can generate multiple sessions.
Engaged sessions
Sessions where the visitor showed meaningful engagement.
Event count
Total tracked interactions, including views, clicks, scrolls, forms and shopping actions.
Key events
Events marked as important in GA4 for conversion-style reporting.