Enhanced Leadership Performance Report
A leadership-focused interpretation of ARC's digital performance, customer intent, acquisition quality and emerging opportunities.
ARC Digital Scorecard
Reach and new-user acquisition softened, but shopping intent and AI-assisted engagement improved materially. This score is an analytical leadership summary rather than a native GA4 metric.
| Area | Status | Assessment |
|---|---|---|
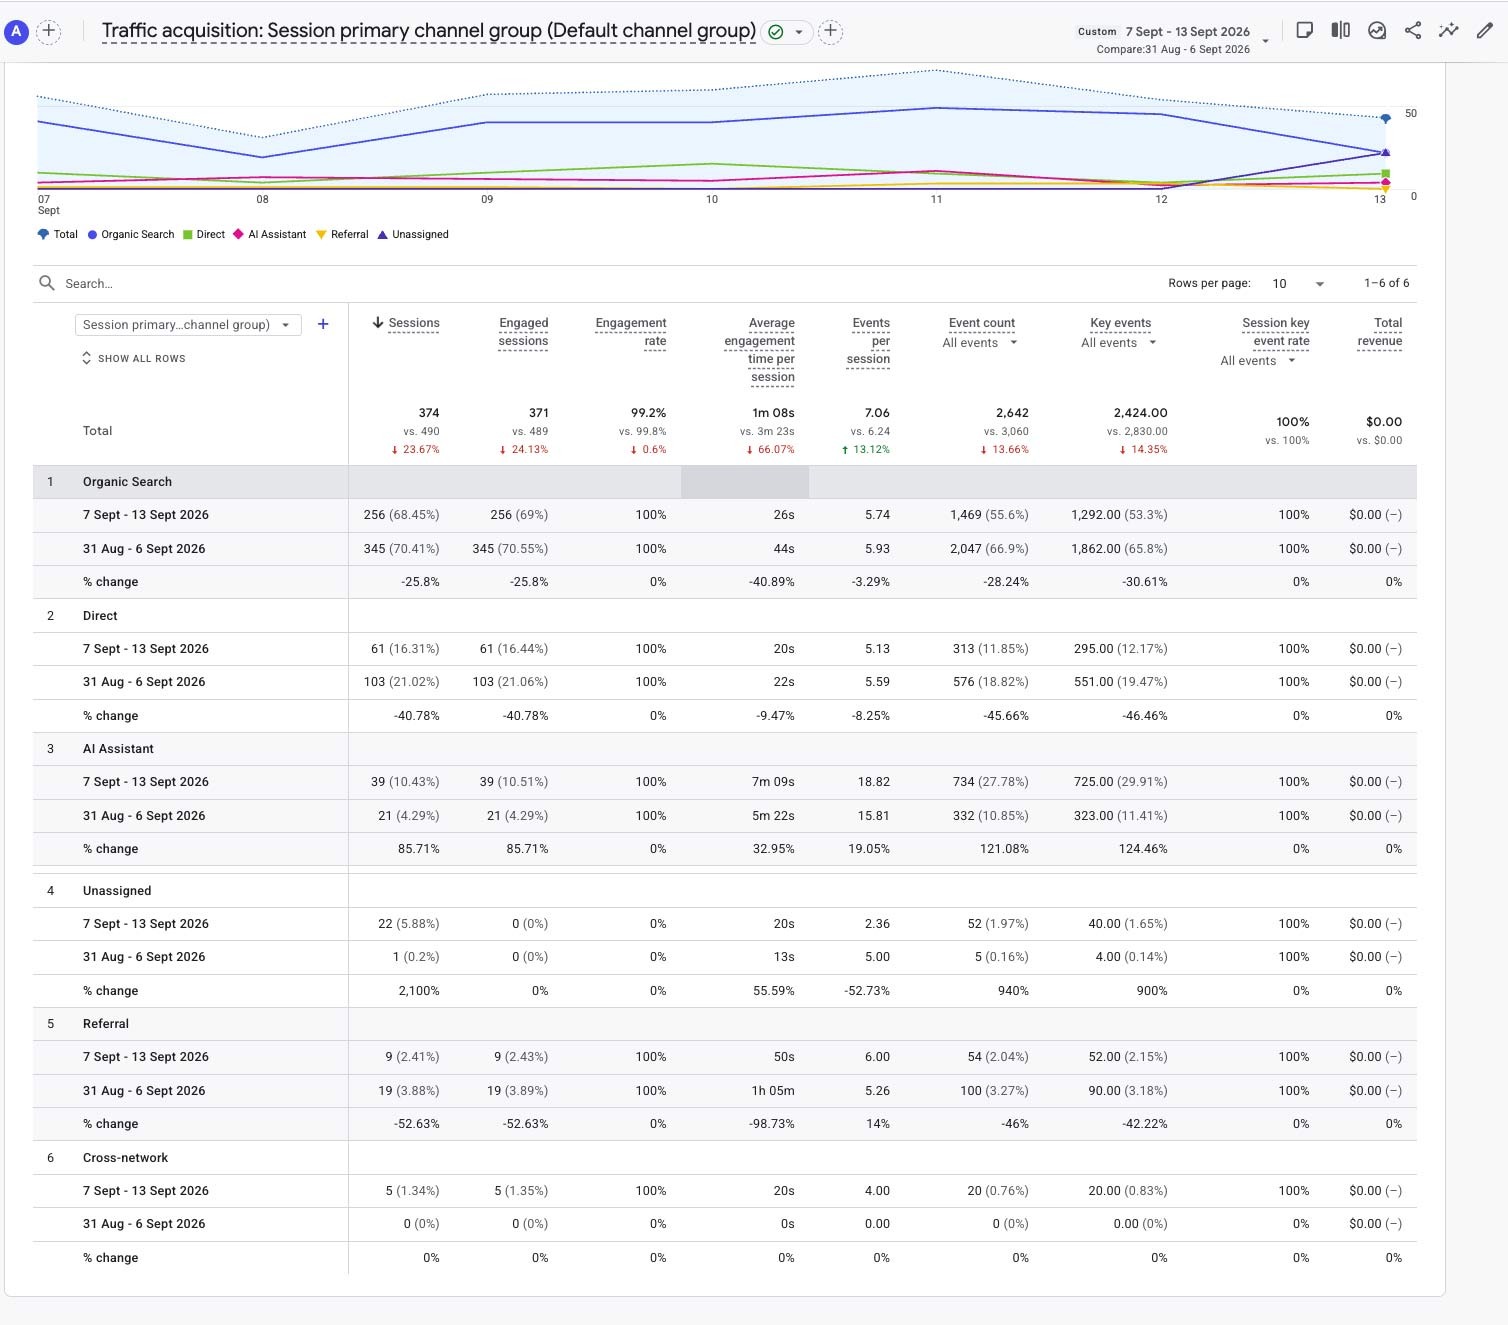
| SEO Momentum | Watch | Organic sessions fell 25.8% to 256. |
| Audience Quality | Mixed | Overall engagement normalized, but action density improved. |
| Customer Intent | Stronger | Click-to-Shop increased 3.9% despite materially fewer sessions. |
| AI Acquisition | Breakout | 39 sessions (+85.7%) with 7m 09s engagement and 18.82 events/session. |
| Attribution | Review | Unassigned returned to 22 sessions. |
Weekly Wins
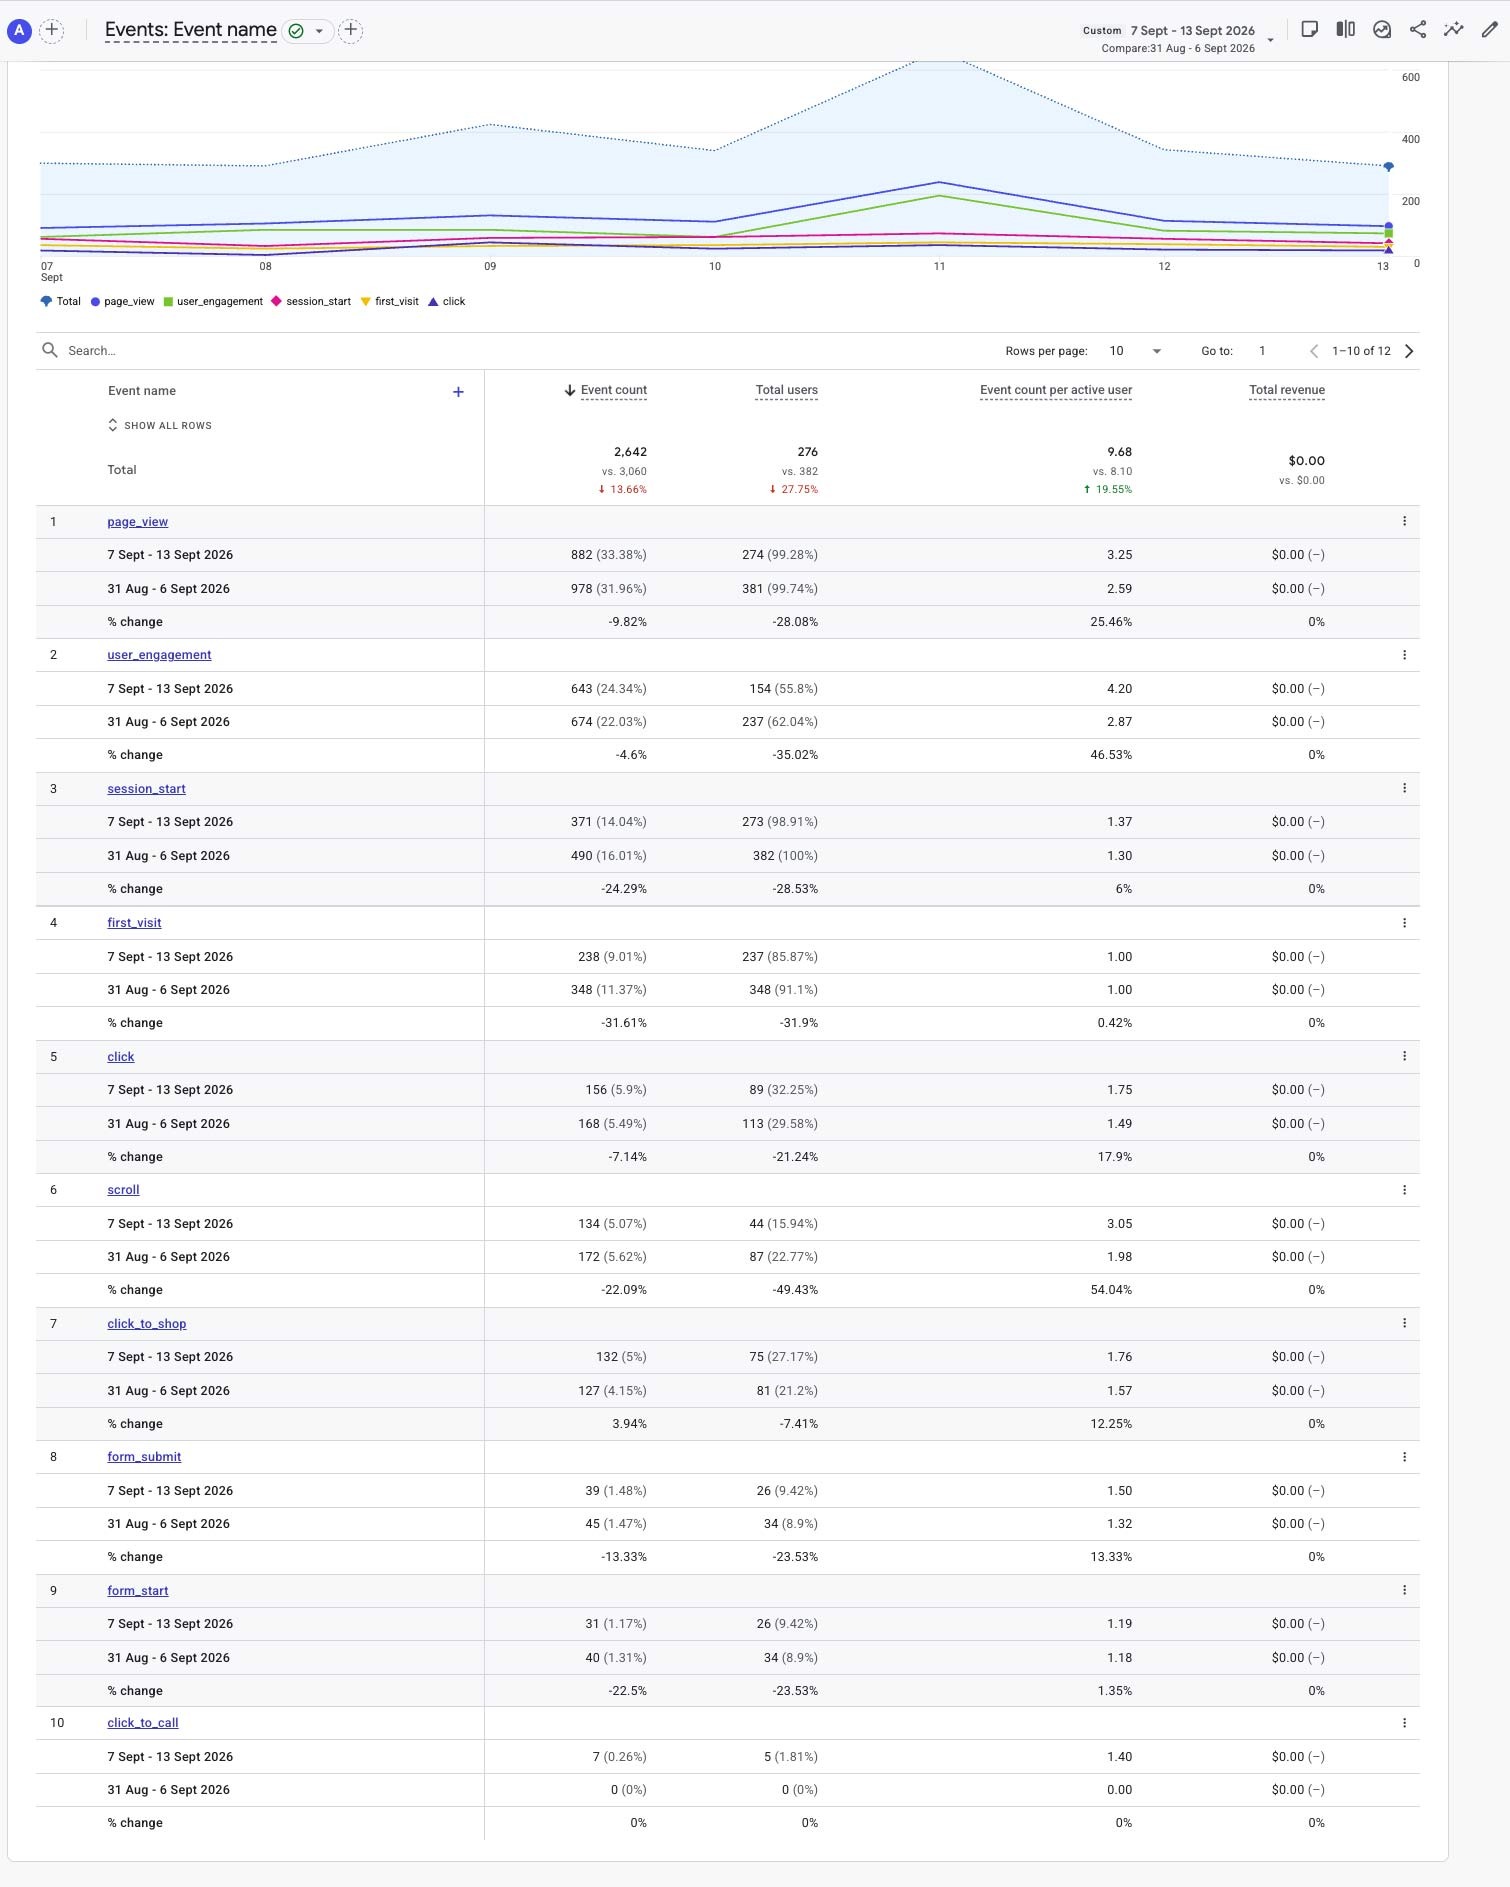
- Click-to-Shop reached 132 (+3.9%).
- AI Assistant increased to 39 sessions (+85.7%).
- AI Assistant engagement reached 7m 09s/session (+33.0%).
- AI Assistant key events increased to 725 (+124.5%).
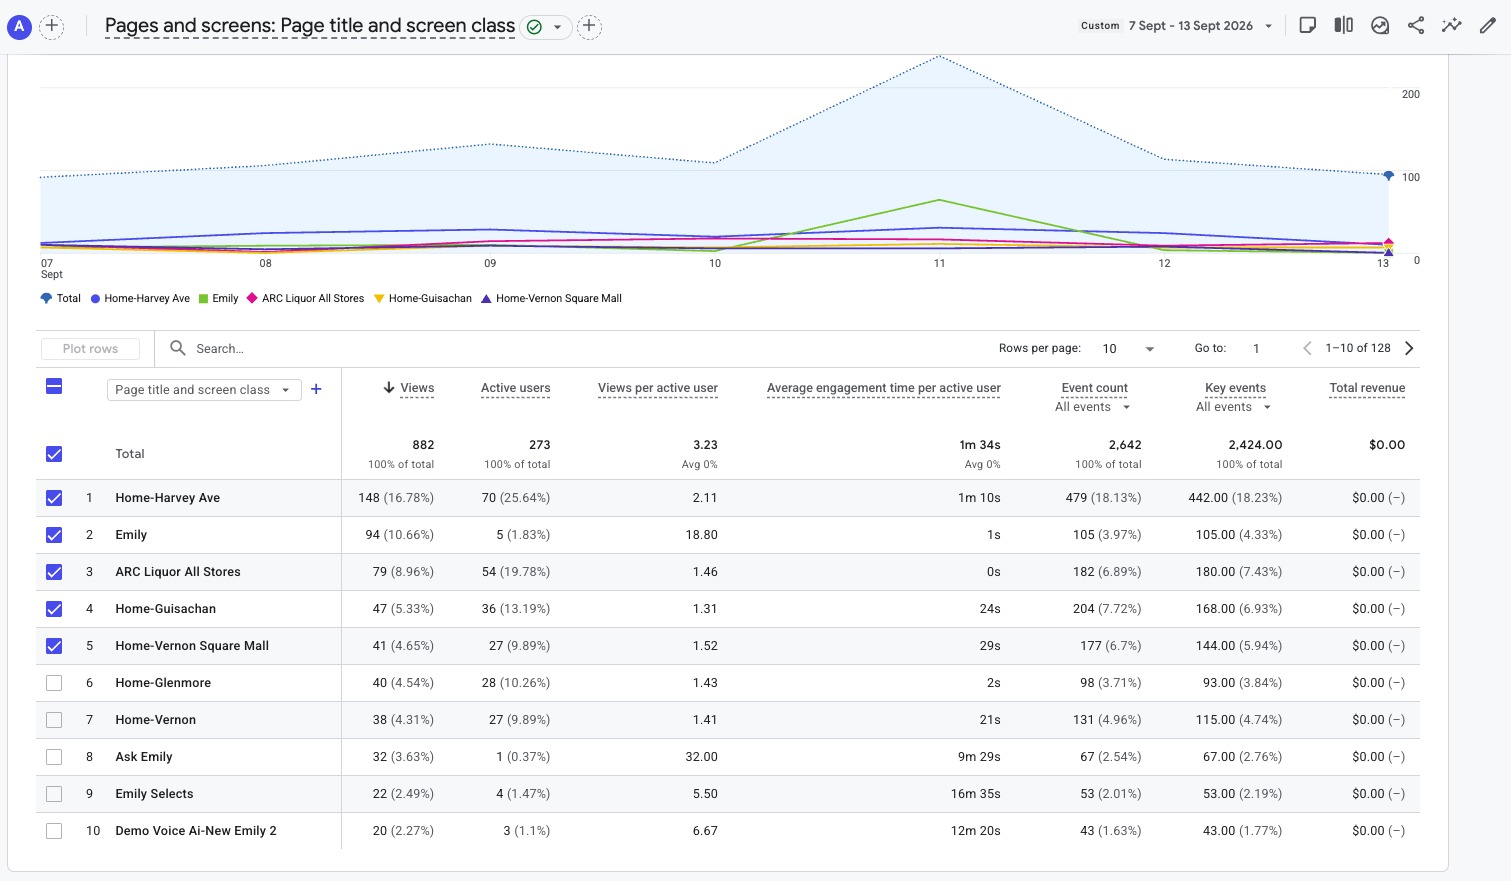
- Harvey Avenue increased to 148 views (+4.2%).
- The Emily ecosystem occupied four Top-10 content positions.
Watch List
- Organic Search declined 25.8%.
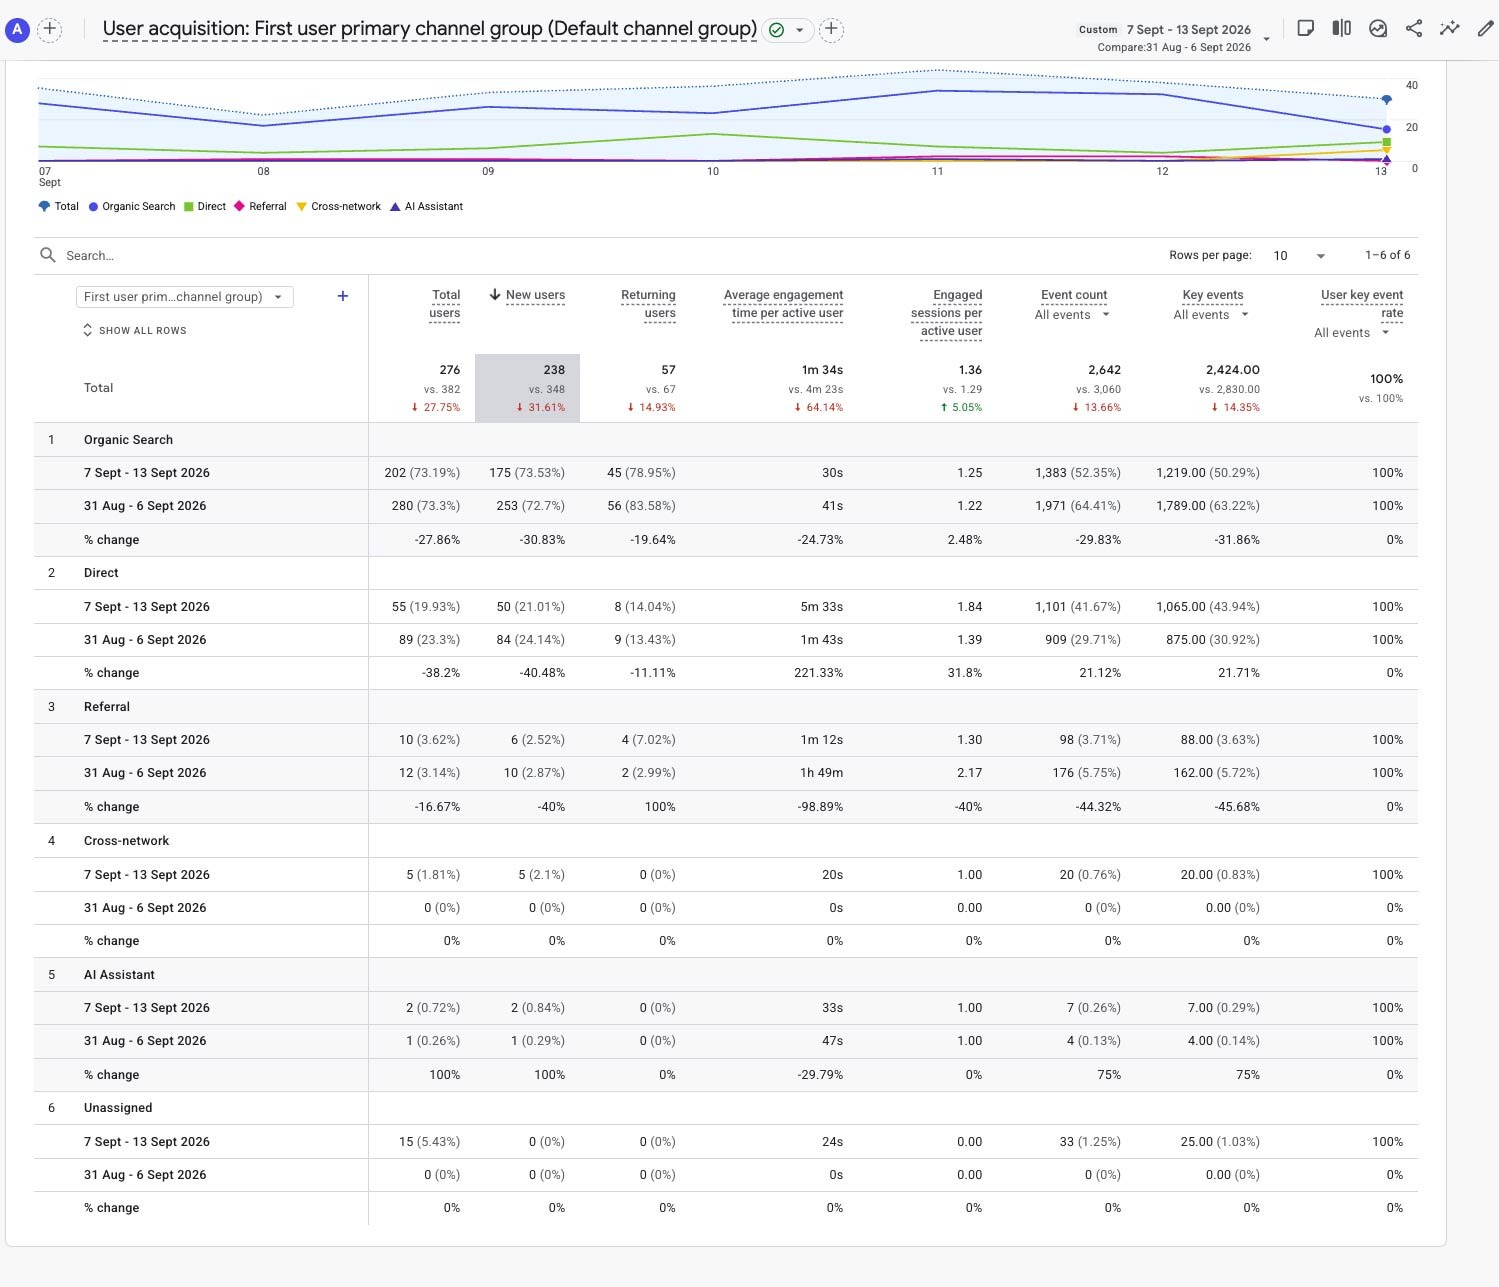
- New users declined 31.6%.
- Average engagement normalized to 1m 34s.
- Form submissions and starts declined.
- 22 Unassigned sessions require attribution review.
Week 26: Fewer Sessions, More Shopping Action
ARC generated 132 Click-to-Shop actions from 374 sessions, compared with 127 from 490 sessions in Week 25. As a simple directional measure, Click-to-Shop actions equalled approximately 35.3% of sessions, up from about 25.9%.
Leadership interpretation: this is not a GA4 conversion-rate metric, but it shows that Week 26's smaller audience produced stronger shopping action density. Combined with the AI Assistant growth, it is the week's clearest positive signal.
Performance Overview
| Metric | This Week | Change |
|---|---|---|
| Sessions | 374 | -23.7% |
| Engaged Sessions | 371 | -24.1% |
| Active Users | 273 | -27.8% |
| New Users | 238 | -31.6% |
| Page Views | 882 | -9.8% |
| Avg Engagement | 1m 34s | -64.1% |
| Total Events | 2,642 | -13.7% |
| Key Events | 2,424 | -14.4% |
| Click-to-Shop | 132 | +3.9% |
Traffic Acquisition
| Channel | Sessions | Change | Leadership Read |
|---|---|---|---|
| Organic Search | 256 | ▼ 25.8% | Still ARC's largest channel at 68.45% of sessions. |
| Direct | 61 | ▼ 40.8% | Lower volume following Week 25's unusually strong Direct result. |
| AI Assistant | 39 | ▲ 85.7% | Standout channel: 7m 09s engagement, 18.82 events/session. |
| Unassigned | 22 | ▲ from 1 | Attribution issue returned and should be reviewed. |
| Referral | 9 | ▼ 52.6% | Small volume; avoid over-interpreting weekly volatility. |
| Cross-network | 5 | New | New small acquisition source this week. |
Store and Content Performance
| Page | Views |
|---|---|
| Home-Harvey Ave | 148 |
| Emily | 94 |
| ARC Liquor All Stores | 79 |
| Home-Guisachan | 47 |
| Home-Vernon Square Mall | 41 |
| Home-Glenmore | 40 |
| Home-Vernon | 38 |
| Ask Emily | 32 |
| Emily Selects | 22 |
| Demo Voice AI-New Emily 2 | 20 |
Interpretation
Harvey Avenue increased to 148 views while the All Stores page held at 79. The Emily ecosystem became unusually prominent: Emily recorded 94 views, Ask Emily 32, Emily Selects 22 and the new Emily Voice AI demo 20. Because several of these experiences are being developed and tested, the figures should be treated as an evolving baseline rather than pure customer demand.
Customer Intent
| Action | Week 26 | Change |
|---|---|---|
| Total Clicks | 156 | -7.1% |
| Click-to-Shop | 132 | +3.9% |
| Form Submissions | 39 | -13.3% |
| Form Starts | 31 | -22.5% |
| Click-to-Call | 7 | New |
What this means: most volume metrics softened, but Click-to-Shop moved against the trend. That suggests the visitors who did reach ARC were disproportionately likely to move toward shopping.
AI Assistant Signal
AI Assistant was Week 26's standout acquisition story. Sessions increased from 21 to 39, average engagement rose from 5m 22s to 7m 09s, events per session increased from 15.81 to 18.82, and key events rose from 323 to 725. At 10.43% of sessions, AI-assisted traffic is no longer merely a trace source and deserves dedicated monitoring.
Recommended Actions
- Investigate the drivers behind AI Assistant growth and engagement.
- Review the 25.8% Organic Search decline.
- Separate Emily development/testing from customer activity where practical.
- Protect the stronger Click-to-Shop action density.
- Review form softness.
- Investigate the return of Unassigned traffic.
Trend Tracker
| Signal | Status | Leadership Read |
|---|---|---|
| Organic Search | Softened | 256 sessions, down 25.8%. |
| Audience Reach | Lower | Sessions -23.7%, active users -27.8%, new users -31.6%. |
| Shopping Intent | Stronger | Click-to-Shop increased to 132 despite lower traffic. |
| AI Assistant | Breakout | 39 sessions, +85.7%, with exceptional engagement depth. |
| Emily | Expanding | Four Emily-related experiences appear in the Top 10. |
| Attribution | Review | 22 Unassigned sessions require investigation. |
Supporting GA4 Reports
These screenshots follow the approved descriptive naming convention for Week 26.